|
GBP/USD technical analysis: Cable collapse to its lowest point since March 2017 as Brexit no-deal looms
- GBP/USD hits its lowest since March 2017.
- The levels to beat for bears are seen at 1.2266 and 1.2189, according to the Technical Confluences Indicator.
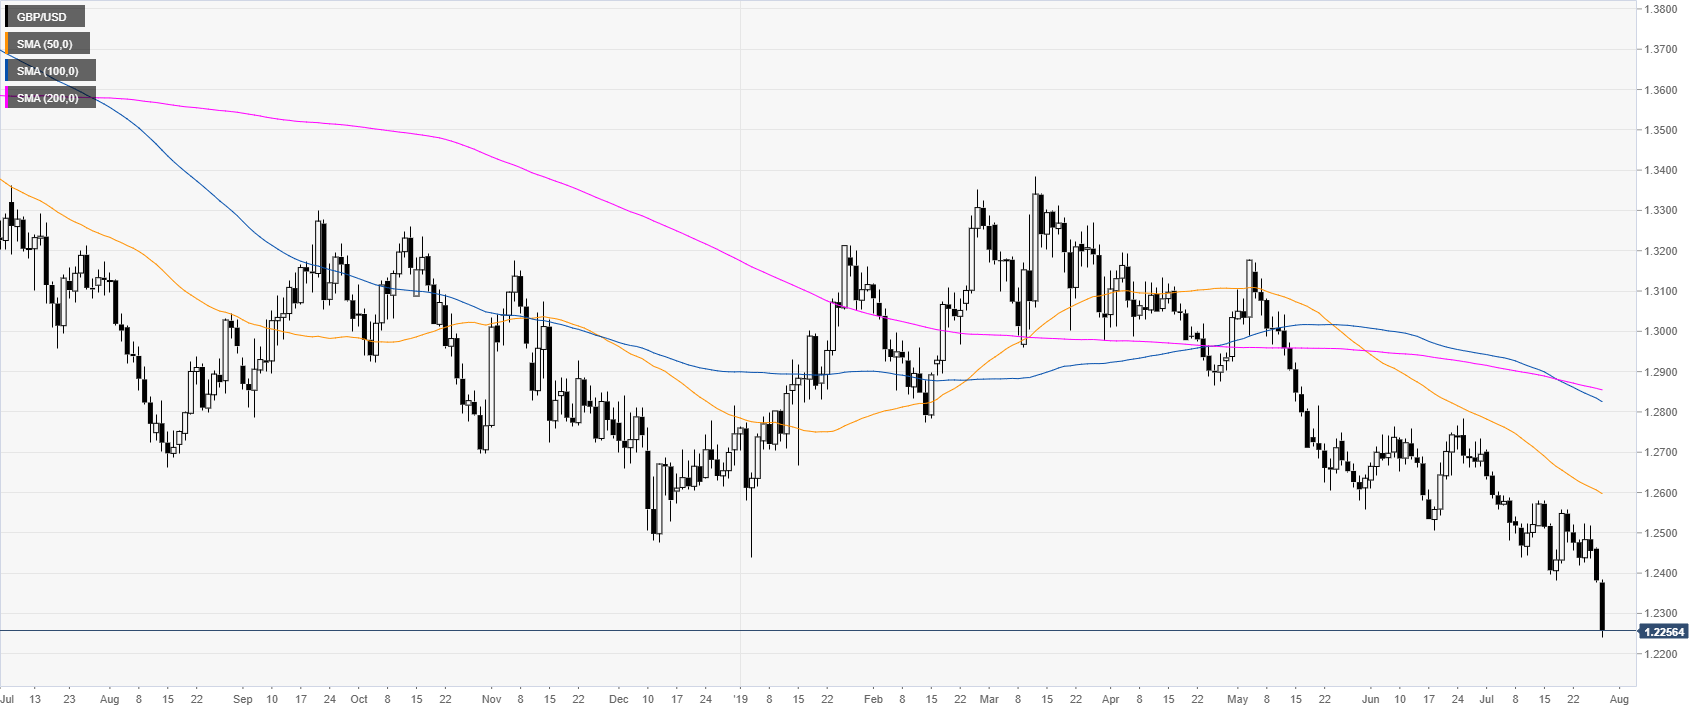
GBP/USD daily chart
Cable started the week losing more than a 100 pips falling to its lowest since March 2017.
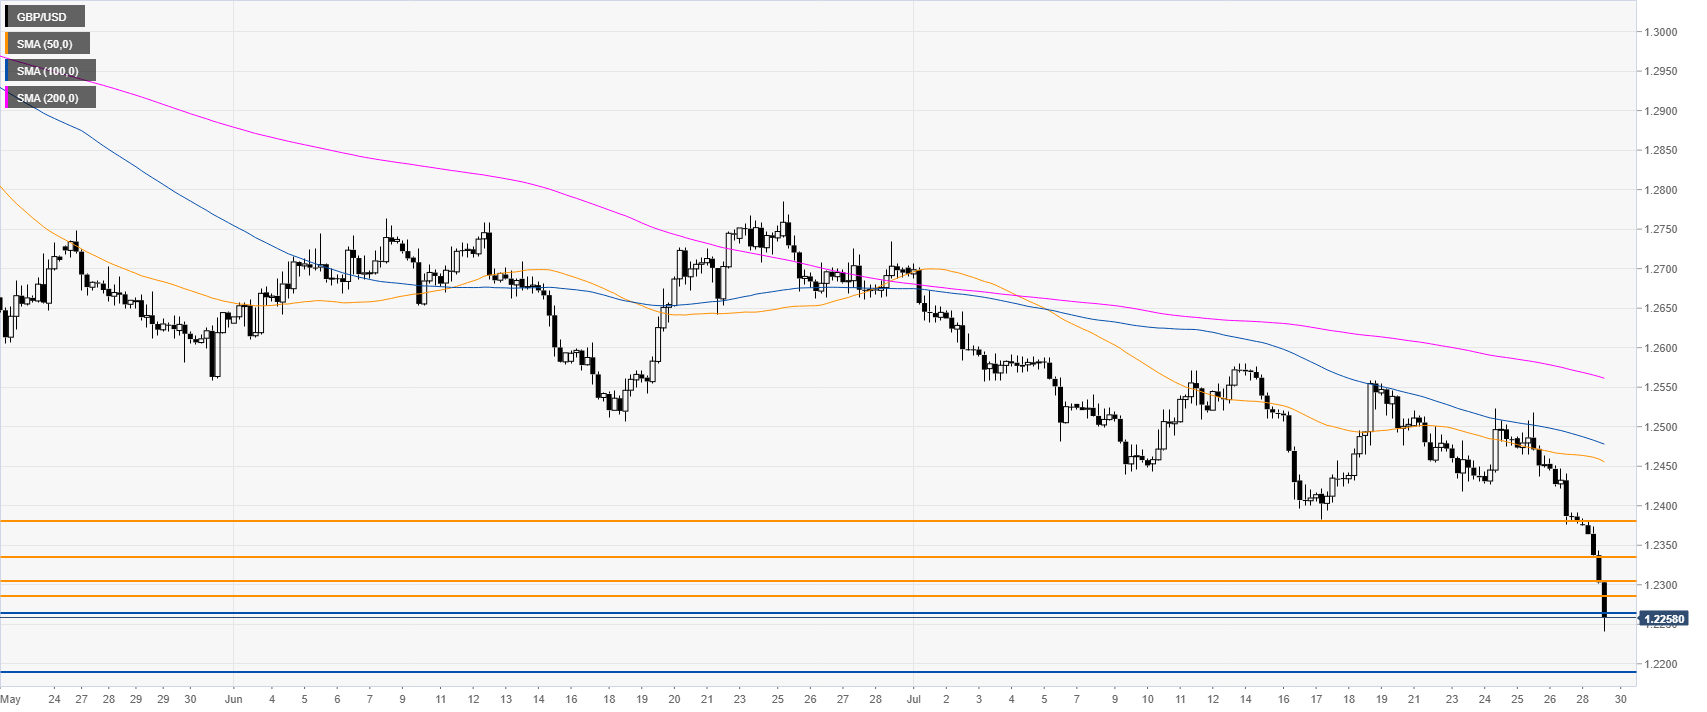
GBP/USD 4-hour chart
GBP/USD is challenging the 1.2266 support at fresh multi-month lows. Bears want to reach 1.2189 on the way down.
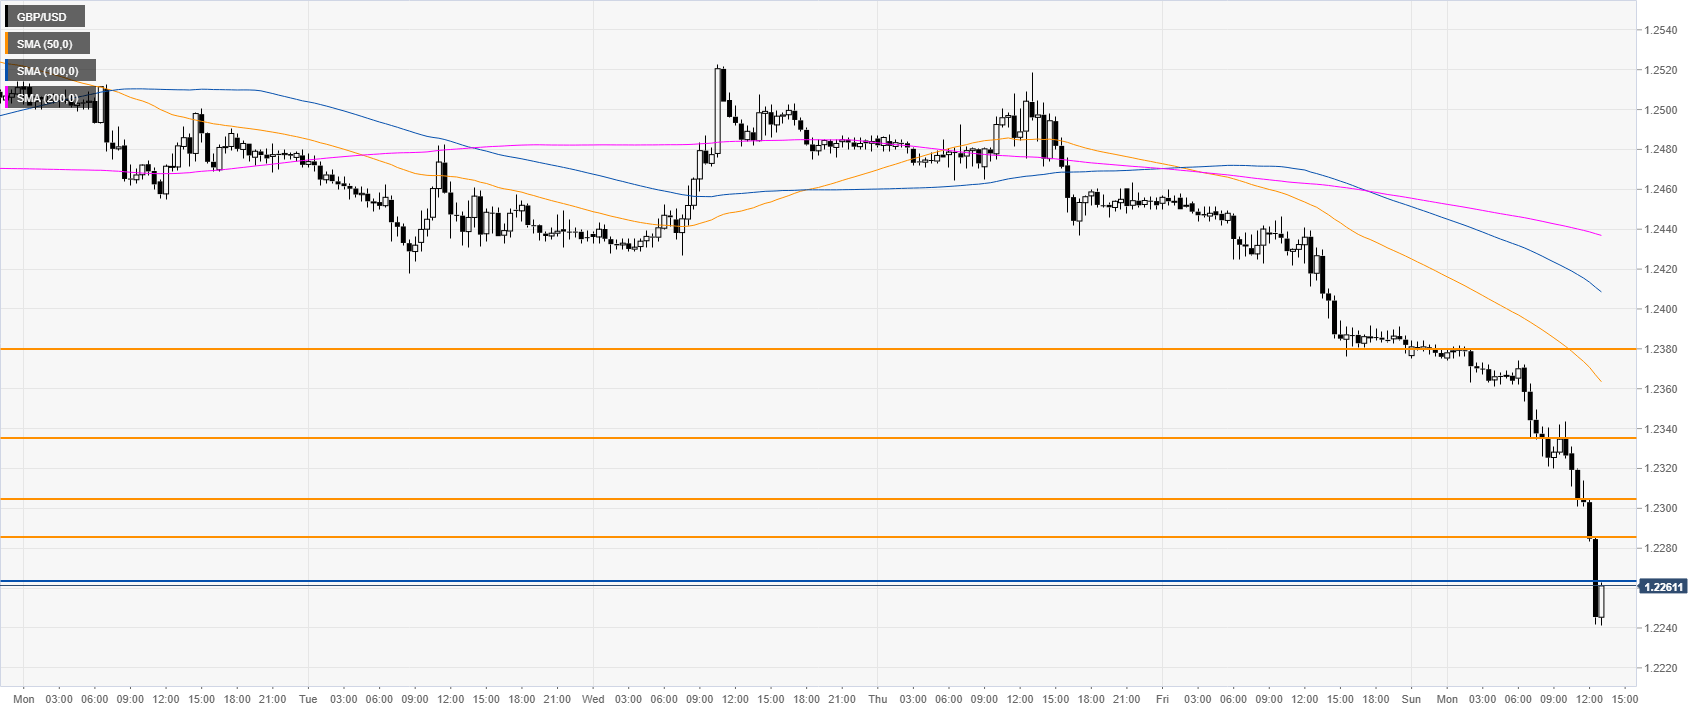
GBP/USD 30-minute chart
Cable has been falling like a rock. Resistances are seen near 1.2285, 1.2304, 1.2336 and 1.2381, according to the Technical Confluences Indicator.
Additional key levels
Author

Flavio Tosti
Independent Analyst
More from Flavio Tosti


