|

GBP/USD technical analysis: 4H 100MA, 1.5-month old resistance-line to challenge recovery

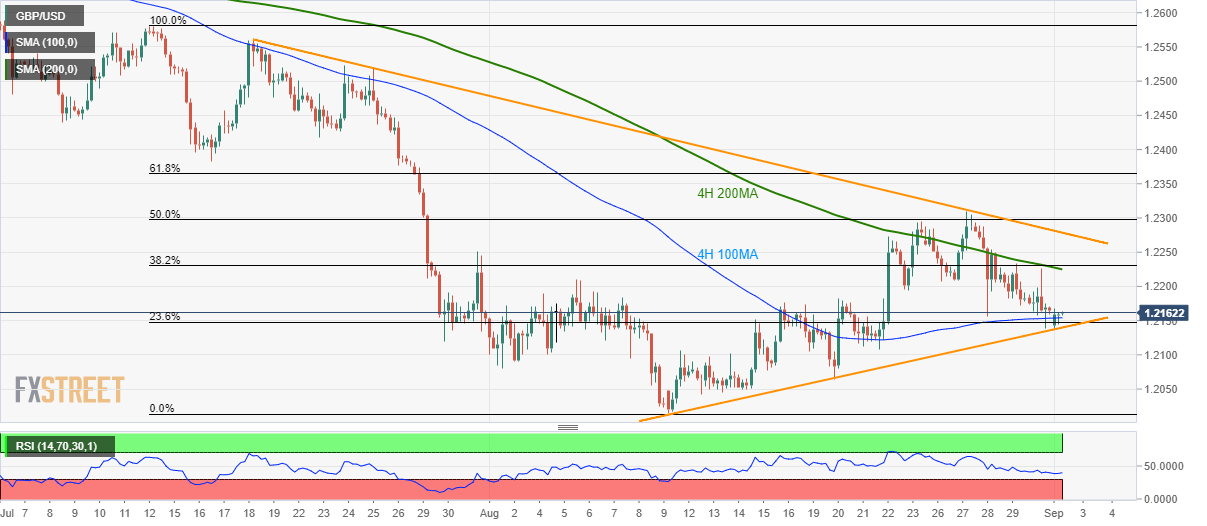
  • GBP/USD pulls back from three-week-old support-line, 4H 100MA and 23.6% Fibonacci retracement level.
  • 4H 200MA and downward sloping trend-line since July 18 question the upside momentum.

GBP/USD’s recent bounce off key short-term supports is less likely to help the quote rise further as the key resistances stand tall to challenge upside momentum while the pair trades near 1.2162 ahead of Monday’s UK market open.

Among them, 200-bar moving average on the four-hour chart (4H 200MA) near 1.2225 and more than a month-old descending trend-line at 1.2280 will appear first to limit the increase.

Should there be further upside past-1.2280, late-August high near 1.2310 and 61.8% Fibonacci retracement of July-August declines, at 1.2365 can please buyers afterward.

On the downside, 4H 100MA, 23.6% Fibonacci retracement and three-week-old rising trend-line together constitute 1.2140/55 as the key support-zone, a break of which can quickly fetch the quote to August 20 low near 1.2065 whereas 1.2015 will entertain bears then after.

GBP/USD 4-hour chart

Trend: bearish

Additional important levels

Overview
Today last price1.2161
Today Daily Change-3 pips
Today Daily Change %-0.02%
Today daily open1.2164
 
Trends
Daily SMA201.2153
Daily SMA501.235
Daily SMA1001.2586
Daily SMA2001.2765
Levels
Previous Daily High1.2226
Previous Daily Low1.2139
Previous Weekly High1.231
Previous Weekly Low1.2139
Previous Monthly High1.231
Previous Monthly Low1.2015
Daily Fibonacci 38.2%1.2172
Daily Fibonacci 61.8%1.2193
Daily Pivot Point S11.2127
Daily Pivot Point S21.2089
Daily Pivot Point S31.2039
Daily Pivot Point R11.2214
Daily Pivot Point R21.2264
Daily Pivot Point R31.2302

Author

Anil Panchal

Anil Panchal

FXStreet

Anil Panchal has nearly 15 years of experience in tracking financial markets. With a keen interest in macroeconomics, Anil aptly tracks global news/updates and stays well-informed about the global financial moves and their implications.

More from Anil Panchal
Share:

Editor's Picks

EUR/USD flirts with weekly lows near 1.1770

EUR/USD now comes under further selling pressure, breaking below the 1.1800 support to challenge the area of weekly throughs near 1.1770 on Thursday. The pair’s decline comes in response to marked gains in the US Dollar amid steady geopolitical tensions. Ealier in the day, the ECB’s Lagarde delivered cautious remarks, although the currency remained apathetic.

GBP/USD threatens the 200-day SMA near 1.3440

GBP/USD rapidly leaves behind Wednesday’s strong advance, coming under heavy pressure and retesting the 1.3440 zone, where the critical 200-day SMA is located. Cable’s deep pullback follows the strong gains in the Greenback, while investors continue to pencil in a potential BoE rate cut in March.

Gold trims gains, slips back to around $5,170

Gold is now facing some downside pressure, hovering around the $5,170 region on Thursday. The yellow metal surrenders part of its earlier gains on the back of the resurgence of the buying interest in the Greenback. In the meantime, geopolitical tensions in the Middle East continue to limit the downside potential for now.

Stellar: Relief bounce fades as bearish undertone persists

Stellar is trading around $0.16 at the time of writing on Thursday after rebounding more than 8% in the previous day. Derivatives data paints a negative picture as XLM’s short bets hit a monthly high while Open Interest continues to decline.

Changing the game: International implications of recent tariff developments

The Supreme Court ruling on International Emergency Economic Powers Act (IEEPA) tariffs provides limited relief for the rest of the world, with weighted average tariff rates modestly lower.

Bitcoin steadies as traders eye US–Iran talks

Bitcoin (BTC) price is stabilizing around $68,000 at the time of writing on Thursday after a 6.2% relief rally the previous day amid a broader downward trend.