GBP/USD slumps below 50-DMA ahead of US inflation, UK’s GDP figures
- GBP sees narrow trade: Lingers below the 50-day EMA, trading at 1.2724, with significant UK GDP data due Friday.
- Bank of England’s stance: Market odds suggest a September rate hike at 85%, potentially peaking the Bank Rate at 5.75% by December.
- Awaiting July US CPI numbers, expectations stand at 0.2% MoM; annual inflation is estimated at 4.8%, guiding Fed’s future decisions.

GBP/USD modestly dives during the North American session, below the 50-day Exponential Moving Average (EMA) even though the US Dollar (USD) remains soft across the board as speculators prepare for the release of inflation data in the United States (US). The GBP/USD is trading at 1.2724, down 0.18%
GBP/USD trend uncertain as market players must diggest US and UK inflation and growth data
The Pound Sterling (GBP) remains trading within a narrow range amid the lack of catalyst during the first part of the week, as UK’s economic docket will reveal its first part of market moving data on Friday, with Gross Domestic Product (GDP) for Q2 on its preliminary reading expected to decelerate to 0%, below the prior’s quarter 0.1% growth, on QoQ data. On a yearly basis, Q2 is estimated to remain unchanged at 0.2%, while MoM data from June is estimated to improve from May’s contraction. If the UK economy shows further weakness, the GBP/USD could accelerate its downtrend, as data could refrain the Bank of England (BoE) from aggressively tightening policy.
Regarding that theme, money market futures odds for a quarter of a percentage point increase by the BoE in September lie at an 85% chance, while for December is fully priced in, suggesting the Bank Rate would peak at 5.75%, against 6.5% at the beginning of August.
Across the pond, the US Department of Labor would release the July inflation report, which is expected to show the US economy deflationary process remains underway, but not as fast as Fed officials expected. The Consumer Price Index, monthly and annually, is foreseen to hit 0.2% and 3%, respectively. Monthly data would remain unchanged from June’s, while year-over-year (YoY) would show an improvement from 3.3%. Excluding volatile items, the so-called core CPI is projected to remain at 0.2% MoM, with annual inflation estimated to be 4.8%, the same as in June.
US central bank officials had begun to split between dovish and hawkish stances. Still, GBP/USD traders must wait for tomorrow’s data, which could shed some light on the US Federal Reserve’s (Fed) forward path on monetary policy.
The CME FedWatch Tool shows odds for a rate hike in September at 13.5%, as money market futures do not expect more borrowing costs to increase. Nonetheless, if Fed officials begin to pile into the dovish stance, any rate cut signals would weaken the greenback; hence further GBP/USD upside is expected.
Given the backdrop, the GBP/USD could remain subdued ahead of US data. After that, an uptick could weigh on the GBP/USD, but UK’s GDP data could rock the boat and shift the pair upwards. Therefore, caution is warranted for GBP/USD traders.
GBP/USD Price Analysis: Technical outlook
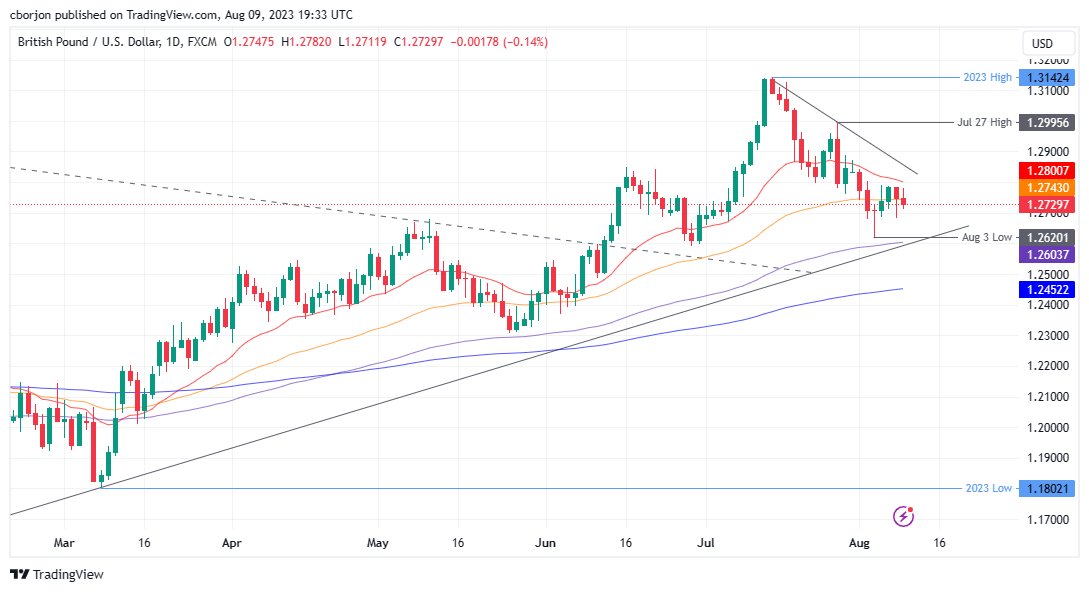
GBP/USD is neutral to downward biased, as it has achieved successive series of lower peaks and throughs, but it remains shy of taking a decisive direction ahead of fundamental news from the US and the UK. As the GBP/USD drops below the 50-day EMA, the next support level to challenge is the current week’s low of 1.2684. A breach of the latter will expose the August 3 low of 1.2620, followed by the 100-day EMA at 1.2603. On the other hand, if GBP/USD reclaims the 20-day EMA at 1.2800, that could pave the way to test a downslope resistance trendline at around 1.2830/40.
Author

Christian Borjon Valencia
FXStreet
Markets analyst, news editor, and trading instructor with over 14 years of experience across FX, commodities, US equity indices, and global macro markets.


