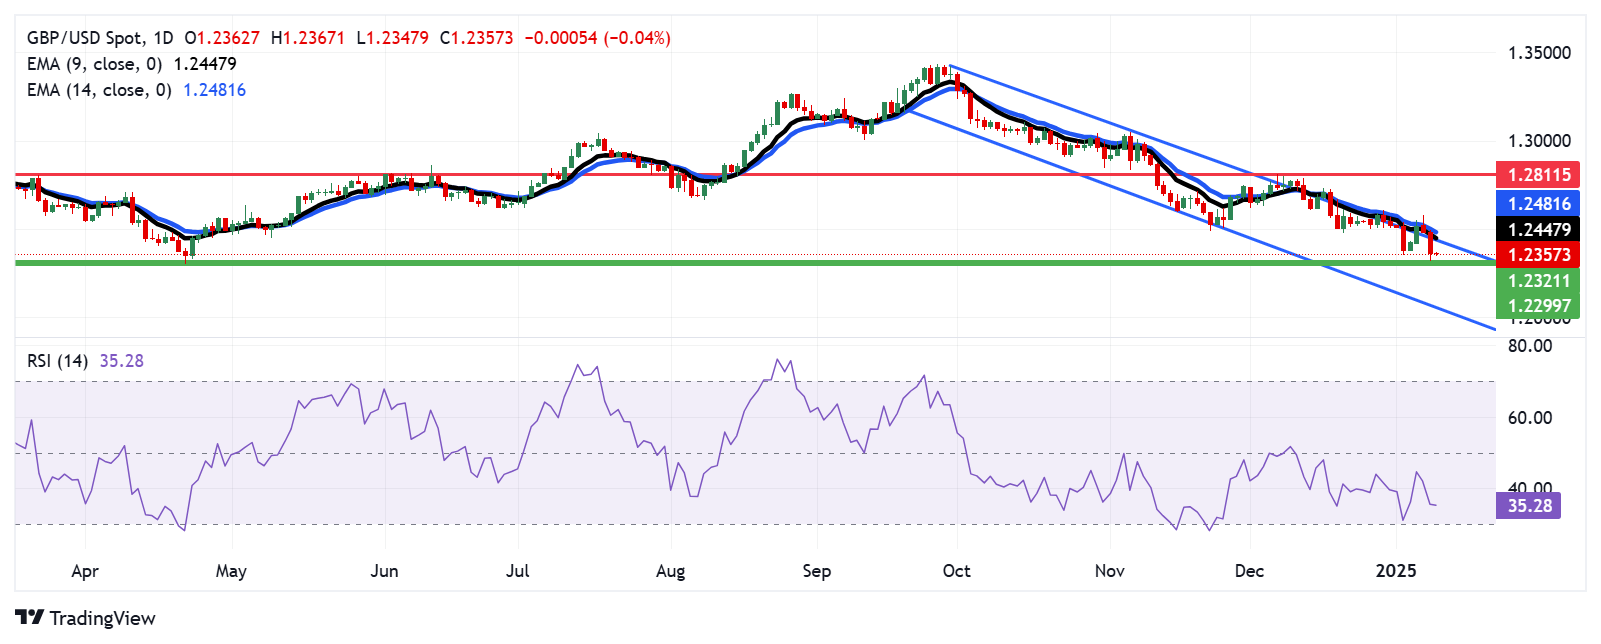
- GBP/USD has retreated into the descending channel pattern, signaling a dominant bearish bias.
- The pair could test the nine-month low at 1.2321, recorded on Wednesday.
- The immediate resistance appears at the descending channel's upper boundary, near the nine-day EMA at 1.2447.
The GBP/USD pair remains under pressure for the third consecutive session, hovering near 1.2360 during Thursday's Asian trading hours. Technical analysis of the daily chart highlights a prevailing bearish bias, with the pair falling back to the descending channel pattern.
The 14-day Relative Strength Index (RSI) approaches the 30 mark, signaling intensified bearish momentum. Additionally, the GBP/USD pair trades below the nine- and 14-day Exponential Moving Averages (EMAs), reflecting weak short-term price dynamics.
On the downside, the GBP/USD pair could test the nine-month low of 1.2321, recorded on January 8, followed by the next support level at 1.2299, the lowest since November 2023, last observed on April 22. A break below this level could strengthen bearish sentiment, potentially driving the pair toward the lower boundary of the descending channel near 1.2050.
On the upside, the GBP/USD pair may encounter immediate resistance at the descending channel's upper boundary, near the nine-day EMA at 1.2447, followed by the 14-day EMA at 1.2481. A decisive breakout above this critical resistance zone could enhance short-term price momentum, paving the way for a potential move toward the two-month high of 1.2811, reached on December 6.
GBP/USD: Daily Chart
British Pound PRICE Today
The table below shows the percentage change of British Pound (GBP) against listed major currencies today. British Pound was the weakest against the Japanese Yen.
| USD | EUR | GBP | JPY | CAD | AUD | NZD | CHF | |
|---|---|---|---|---|---|---|---|---|
| USD | -0.03% | 0.04% | -0.27% | -0.12% | 0.14% | 0.06% | -0.19% | |
| EUR | 0.03% | 0.07% | -0.23% | -0.09% | 0.18% | 0.09% | -0.16% | |
| GBP | -0.04% | -0.07% | -0.33% | -0.16% | 0.10% | 0.03% | -0.21% | |
| JPY | 0.27% | 0.23% | 0.33% | 0.14% | 0.41% | 0.29% | 0.10% | |
| CAD | 0.12% | 0.09% | 0.16% | -0.14% | 0.27% | 0.18% | -0.05% | |
| AUD | -0.14% | -0.18% | -0.10% | -0.41% | -0.27% | -0.09% | -0.31% | |
| NZD | -0.06% | -0.09% | -0.03% | -0.29% | -0.18% | 0.09% | -0.22% | |
| CHF | 0.19% | 0.16% | 0.21% | -0.10% | 0.05% | 0.31% | 0.22% |
The heat map shows percentage changes of major currencies against each other. The base currency is picked from the left column, while the quote currency is picked from the top row. For example, if you pick the British Pound from the left column and move along the horizontal line to the US Dollar, the percentage change displayed in the box will represent GBP (base)/USD (quote).
Information on these pages contains forward-looking statements that involve risks and uncertainties. Markets and instruments profiled on this page are for informational purposes only and should not in any way come across as a recommendation to buy or sell in these assets. You should do your own thorough research before making any investment decisions. FXStreet does not in any way guarantee that this information is free from mistakes, errors, or material misstatements. It also does not guarantee that this information is of a timely nature. Investing in Open Markets involves a great deal of risk, including the loss of all or a portion of your investment, as well as emotional distress. All risks, losses and costs associated with investing, including total loss of principal, are your responsibility. The views and opinions expressed in this article are those of the authors and do not necessarily reflect the official policy or position of FXStreet nor its advertisers. The author will not be held responsible for information that is found at the end of links posted on this page.
If not otherwise explicitly mentioned in the body of the article, at the time of writing, the author has no position in any stock mentioned in this article and no business relationship with any company mentioned. The author has not received compensation for writing this article, other than from FXStreet.
FXStreet and the author do not provide personalized recommendations. The author makes no representations as to the accuracy, completeness, or suitability of this information. FXStreet and the author will not be liable for any errors, omissions or any losses, injuries or damages arising from this information and its display or use. Errors and omissions excepted.
The author and FXStreet are not registered investment advisors and nothing in this article is intended to be investment advice.


Recommended content
Editors’ Picks

GBP/USD stays pressured below 1.3300 after UK Retail Sales data
GBP/USD remains under moderate selling pressure below 1.3300 despite the upbeat UK Retail Sales data for March. The pair feels the heat of the solid US Dollar rebound, aided by a Bloomberg report, which indicated China may suspend its 125% tariff on select US imports.

EUR/USD slides toward 1.1300 as US Dollar jumps on US-China trade optimism
EUR/USD extends the drop toward 1.1300 in European trading on Friday. Broad US Dollar resurgence on optimism surrounding the US-China trade war de-escalation weighs heavily on the pair. Trade talks and US data remain in focus.

Gold price drifts lower as US-China trade deal hopes undermine safe-haven assets
Gold price bulls seem reluctant as a positive risk tone undermines demand for safe-haven assets. Thursday’s upbeat US macro data supports the USD, contributing to capping the precious metal. Geopolitical uncertainties and Fed rate cut bets should help limit losses for the XAU/USD pair.

Ethereum: Accumulation addresses grab 1.11 million ETH as bullish momentum rises
Ethereum saw a 1% decline on Friday as sellers dominated exchange activity in the past 24 hours. Despite the recent selling, increased inflows into accumulation addresses and declining net taker volume show a gradual return of bullish momentum.

Five fundamentals for the week: Traders confront the trade war, important surveys, key Fed speech Premium
Will the US strike a trade deal with Japan? That would be positive progress. However, recent developments are not that positive, and there's only one certainty: headlines will dominate markets. Fresh US economic data is also of interest.

The Best brokers to trade EUR/USD
SPONSORED Discover the top brokers for trading EUR/USD in 2025. Our list features brokers with competitive spreads, fast execution, and powerful platforms. Whether you're a beginner or an expert, find the right partner to navigate the dynamic Forex market.