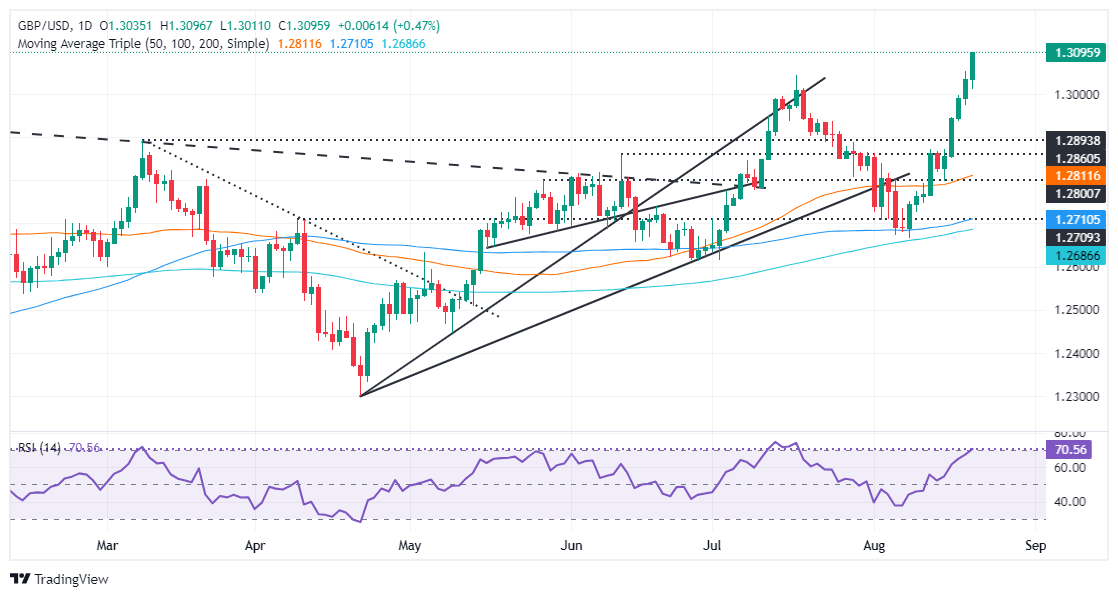
- GBP/USD extends its uptrend after bouncing off the 50-DMA at 1.2809, with RSI indicating strong bullish momentum.
- A break above 1.3100 targets the 2023 peak at 1.3142, with further gains possible toward 1.3200.
- If the pair retreats, support lies at the July 17 high of 1.3044, followed by the psychological 1.3000 level and August 13 high at 1.2872.
The GBP/USD advanced steadily for the fifth straight day and is eyeing the 1.3100 figure after data from the US Bureau of Labor Statistics (BLS) revealed that the US economy added 800K fewer Americans to the workforce. At the time of writing, the pair trades at 1.308 and gains 0.42%.
GBP/USD Price Forecast: Technical outlook
The GBP/USD uptrend remains intact after bouncing off the 50-day moving average (DMA) at 1.2809 on August 15. The Relative Strength Index (RSI) shows momentum favoring buyers, though the pair could consolidate soon as the RSI approaches overbought levels.
If GBP/USD climbs above 1.3100, the next stop would be the t 2023 peak at 1.3142. On further strength, the next stop would be 1.3200.
Conversely, if GBP/USD retreats below the July 17 high of 1.3044, that would pave the way for a pullback. The psychological 1.3000 figure would be the next support, followed by the August 13 high at 1.2872.
GBP/USD Price Action – Daily Chart
British Pound PRICE Today
The table below shows the percentage change of British Pound (GBP) against listed major currencies today. British Pound was the strongest against the Australian Dollar.
| USD | EUR | GBP | JPY | CAD | AUD | NZD | CHF | |
|---|---|---|---|---|---|---|---|---|
| USD | -0.21% | -0.46% | -0.16% | -0.20% | 0.02% | -0.12% | -0.40% | |
| EUR | 0.21% | -0.26% | 0.03% | 0.00% | 0.26% | 0.08% | -0.19% | |
| GBP | 0.46% | 0.26% | 0.32% | 0.29% | 0.49% | 0.35% | 0.09% | |
| JPY | 0.16% | -0.03% | -0.32% | -0.04% | 0.20% | 0.00% | -0.22% | |
| CAD | 0.20% | -0.01% | -0.29% | 0.04% | 0.24% | 0.06% | -0.21% | |
| AUD | -0.02% | -0.26% | -0.49% | -0.20% | -0.24% | -0.18% | -0.41% | |
| NZD | 0.12% | -0.08% | -0.35% | -0.00% | -0.06% | 0.18% | -0.25% | |
| CHF | 0.40% | 0.19% | -0.09% | 0.22% | 0.21% | 0.41% | 0.25% |
The heat map shows percentage changes of major currencies against each other. The base currency is picked from the left column, while the quote currency is picked from the top row. For example, if you pick the British Pound from the left column and move along the horizontal line to the US Dollar, the percentage change displayed in the box will represent GBP (base)/USD (quote).
Information on these pages contains forward-looking statements that involve risks and uncertainties. Markets and instruments profiled on this page are for informational purposes only and should not in any way come across as a recommendation to buy or sell in these assets. You should do your own thorough research before making any investment decisions. FXStreet does not in any way guarantee that this information is free from mistakes, errors, or material misstatements. It also does not guarantee that this information is of a timely nature. Investing in Open Markets involves a great deal of risk, including the loss of all or a portion of your investment, as well as emotional distress. All risks, losses and costs associated with investing, including total loss of principal, are your responsibility. The views and opinions expressed in this article are those of the authors and do not necessarily reflect the official policy or position of FXStreet nor its advertisers. The author will not be held responsible for information that is found at the end of links posted on this page.
If not otherwise explicitly mentioned in the body of the article, at the time of writing, the author has no position in any stock mentioned in this article and no business relationship with any company mentioned. The author has not received compensation for writing this article, other than from FXStreet.
FXStreet and the author do not provide personalized recommendations. The author makes no representations as to the accuracy, completeness, or suitability of this information. FXStreet and the author will not be liable for any errors, omissions or any losses, injuries or damages arising from this information and its display or use. Errors and omissions excepted.
The author and FXStreet are not registered investment advisors and nothing in this article is intended to be investment advice.


Recommended content
Editors’ Picks

EUR/USD remains offered around 1.1380
The EUR/USD maintains its bearish tone on Tuesday, presently lingering around the 1.1380 zone amid the persistent buying pressure on the US Dollar. The improved sentiment in the Greenback comes amid rising US yields and mixed US data results from JOLTs and US Factory Orders.

GBP/USD treads water in the low-1.3500s
GBP/USD stays in the offered position on Tuesday and trades in the low-1.3500s, constantly following the strong rise in the Greenback. In the meanwhile, Cable's price movement is in line with Bailey's cautious tone and the mixed data from the US docket.

Gold holds on to higher ground around $3,350
Gold is falling from its multi-week high of over $3,400 achieved on Monday. It is currently losing further momentum and flirting with the $3,350 region per troy ounce on the back of a strong Greenback, higher yields and mixed US data.

Cardano Price Forecast: Sign of robust bullish reversal emerges despite dwindling DeFi TVL volume
Cardano rebounds to test resistance at $0.69 as technical indicator flashes a buy signal. A minor increase in the derivative Open Interest to $831 million suggests growing trader interest in ADA.

AUD/USD drifts lower amid cautious RBA, global trade uncertainty
AUD/USD retreats to 0.6460 as Aussie loses ground after Monday’s rally. RBA minutes reveal that the board debated a 50 bps interest rate cut but opted for a 25 bps cut to preserve predictability. Focus shifts to US JOLTS Job Openings due later in the day, Wednesday’s Australian GDP and Friday’s NFP for fresh cues.

The Best brokers to trade EUR/USD
SPONSORED Discover the top brokers for trading EUR/USD in 2025. Our list features brokers with competitive spreads, fast execution, and powerful platforms. Whether you're a beginner or an expert, find the right partner to navigate the dynamic Forex market.