- GBP/USD may aim for immediate resistance at the four-month high of 1.2989.
- If the 14-day RSI exceeds 70, it will signal overbought conditions and a potential downward correction.
- The pair is expected to find immediate support at the nine-day EMA of 1.2895.
The GBP/USD pair extends its losing streak for the third successive session, trading around 1.2940 during the Asian hours on Monday. Technical analysis of the daily chart suggests a continued bullish bias, with the pair moving upwards within an ascending channel pattern.
The 14-day Relative Strength Index (RSI) remains slightly below 70, indicating strengthened bullish momentum. Further gains will indicate an overbought condition and downward correction sooner. Moreover, the GBP/USD pair continues to trade above the nine-day Exponential Moving Average (EMA), reinforcing strong short-term price dynamics and confirming the ongoing upward trend.
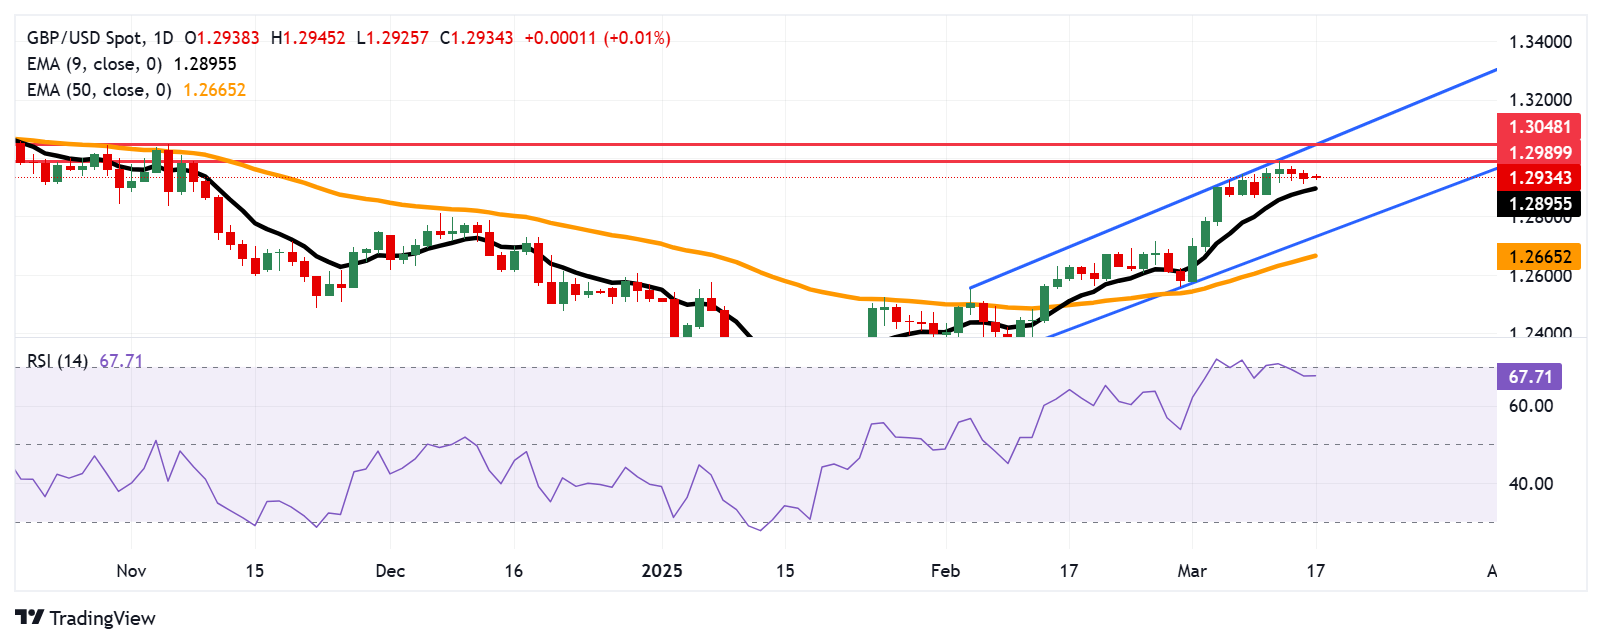
On the upside, the GBP/USD pair may challenge primary resistance at the four-month high of 1.2989, reached on March 12, followed by the five-month high at 1.3048, recorded on November 6, and ascending channel’s upper boundary near 1.3050.
The GBP/USD pair is likely to find immediate support at the nine-day EMA of 1.2895. A break below this level could weaken short-term price momentum, potentially driving the pair toward the ascending channel’s lower boundary near 1.2730, followed by the 50-day EMA at 1.2665.
GBP/USD: Daily Chart
British Pound PRICE Today
The table below shows the percentage change of British Pound (GBP) against listed major currencies today. British Pound was the weakest against the Canadian Dollar.
| USD | EUR | GBP | JPY | CAD | AUD | NZD | CHF | |
|---|---|---|---|---|---|---|---|---|
| USD | -0.03% | 0.03% | 0.10% | -0.06% | 0.12% | -0.18% | -0.06% | |
| EUR | 0.03% | -0.06% | -0.28% | -0.02% | 0.00% | -0.17% | -0.06% | |
| GBP | -0.03% | 0.06% | 0.10% | -0.17% | 0.06% | -0.12% | -0.06% | |
| JPY | -0.10% | 0.28% | -0.10% | -0.15% | -0.19% | -0.23% | -0.28% | |
| CAD | 0.06% | 0.02% | 0.17% | 0.15% | -0.03% | -0.13% | -0.55% | |
| AUD | -0.12% | -0.01% | -0.06% | 0.19% | 0.03% | -0.15% | -0.05% | |
| NZD | 0.18% | 0.17% | 0.12% | 0.23% | 0.13% | 0.15% | 0.11% | |
| CHF | 0.06% | 0.06% | 0.06% | 0.28% | 0.55% | 0.05% | -0.11% |
The heat map shows percentage changes of major currencies against each other. The base currency is picked from the left column, while the quote currency is picked from the top row. For example, if you pick the British Pound from the left column and move along the horizontal line to the US Dollar, the percentage change displayed in the box will represent GBP (base)/USD (quote).
Information on these pages contains forward-looking statements that involve risks and uncertainties. Markets and instruments profiled on this page are for informational purposes only and should not in any way come across as a recommendation to buy or sell in these assets. You should do your own thorough research before making any investment decisions. FXStreet does not in any way guarantee that this information is free from mistakes, errors, or material misstatements. It also does not guarantee that this information is of a timely nature. Investing in Open Markets involves a great deal of risk, including the loss of all or a portion of your investment, as well as emotional distress. All risks, losses and costs associated with investing, including total loss of principal, are your responsibility. The views and opinions expressed in this article are those of the authors and do not necessarily reflect the official policy or position of FXStreet nor its advertisers. The author will not be held responsible for information that is found at the end of links posted on this page.
If not otherwise explicitly mentioned in the body of the article, at the time of writing, the author has no position in any stock mentioned in this article and no business relationship with any company mentioned. The author has not received compensation for writing this article, other than from FXStreet.
FXStreet and the author do not provide personalized recommendations. The author makes no representations as to the accuracy, completeness, or suitability of this information. FXStreet and the author will not be liable for any errors, omissions or any losses, injuries or damages arising from this information and its display or use. Errors and omissions excepted.
The author and FXStreet are not registered investment advisors and nothing in this article is intended to be investment advice.


Recommended content
Editors’ Picks

Gold falls amid a possible de-escalation of US-China tensions Premium
Gold pulled back from its all-time high of $3,500 per troy ounce reached earlier on Tuesday, as a resurgent US Dollar and signs of easing tensions in the US–China trade dispute appeared to draw sellers back into the market.

EUR/USD retreats to daily lows near 1.1440
EUR/USD loses the grip and retreats to the 1.1440 zone as the Greenback’s rebound now gathers extra steam, particulalry after some positive headlines pointing to mitigating trade concerns on the US-China front on Tuesday.

GBP/USD deflates to weekly lows near 1.3350
GBP/USD loses further momentum and recedes to the 1.3350 zone on Tuesday, or two-day troughs, all in response to the frmer tone in the US Dollar and encouraging news from the US-China trade scenario.

3% of Bitcoin supply in control of firms with BTC on balance sheets: The good, bad and ugly
Bitcoin disappointed traders with lackluster performance in 2025, hitting the $100,000 milestone and consolidating under the milestone thereafter. Bitcoin rallied past $88,000 early on Monday, the dominant token eyes the $90,000 level.

Five fundamentals for the week: Traders confront the trade war, important surveys, key Fed speech Premium
Will the US strike a trade deal with Japan? That would be positive progress. However, recent developments are not that positive, and there's only one certainty: headlines will dominate markets. Fresh US economic data is also of interest.

The Best brokers to trade EUR/USD
SPONSORED Discover the top brokers for trading EUR/USD in 2025. Our list features brokers with competitive spreads, fast execution, and powerful platforms. Whether you're a beginner or an expert, find the right partner to navigate the dynamic Forex market.