GBP/USD Price Forecast: Holds position above 1.3000 with testing yearly highs
- GBP/USD tests a yearly high of 1.3044 level, marked on July 17.
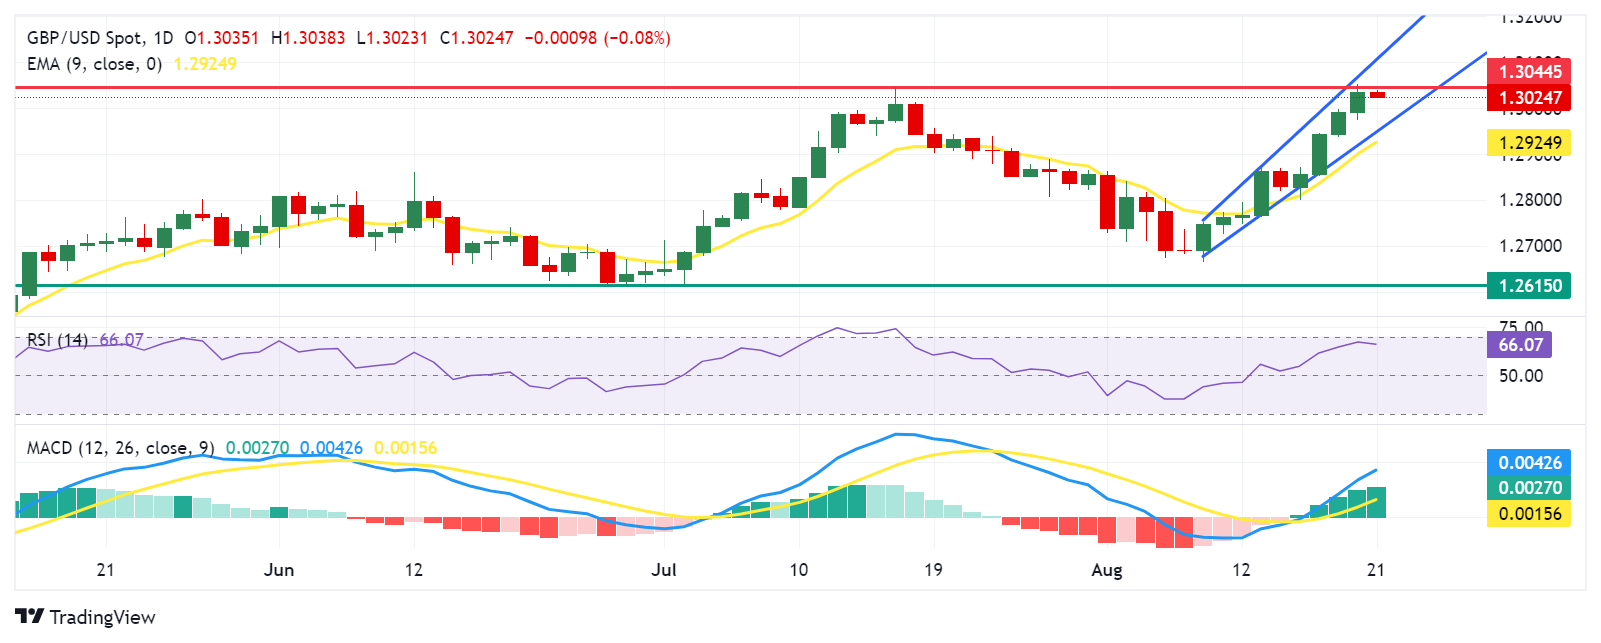
- The momentum indicator 14-day RSI is positioned slightly below 70 level, suggesting a potential correction soon.
- The pair may navigate the area around the lower boundary of the ascending channel at the 1.2950 level.

GBP/USD halts its four-day winning streak, trading around 1.3020 during Wednesday’s Asian session. The daily chart analysis shows the pair is trending upwards within an ascending channel pattern, suggesting a bullish bias.
The Moving Average Convergence Divergence (MACD) indicator suggests bullish momentum, as the MACD line is above the centreline and shows divergence above the signal line. Additionally, the 14-day Relative Strength Index (RSI) consolidates slightly below 70 level, suggesting a potential correction in the short term.
For resistance, the GBP/USD pair is testing a yearly high of 1.3044 level, reached on July 17. A break above this level could lead the pair to explore the region around the upper boundary of the ascending channel at 1.3100 level.
On the downside, the GBP/USD pair may navigate the area around the lower boundary of the ascending channel at the 1.2950 level, followed by the nine-day Exponential Moving Average (EMA) at the 1.2924 level. A break below the latter could guide the pair toward the throwback support at the 1.2615 level, noted in June.
GBP/USD: Daily Chart
British Pound PRICE Today
The table below shows the percentage change of British Pound (GBP) against listed major currencies today. British Pound was the weakest against the Canadian Dollar.
| USD | EUR | GBP | JPY | CAD | AUD | NZD | CHF | |
|---|---|---|---|---|---|---|---|---|
| USD | 0.10% | 0.08% | 0.29% | -0.04% | 0.04% | 0.24% | 0.03% | |
| EUR | -0.10% | -0.03% | 0.16% | -0.13% | -0.04% | 0.12% | -0.09% | |
| GBP | -0.08% | 0.03% | 0.23% | -0.09% | -0.03% | 0.16% | -0.04% | |
| JPY | -0.29% | -0.16% | -0.23% | -0.33% | -0.24% | -0.11% | -0.27% | |
| CAD | 0.04% | 0.13% | 0.09% | 0.33% | 0.09% | 0.24% | 0.05% | |
| AUD | -0.04% | 0.04% | 0.03% | 0.24% | -0.09% | 0.15% | -0.03% | |
| NZD | -0.24% | -0.12% | -0.16% | 0.11% | -0.24% | -0.15% | -0.19% | |
| CHF | -0.03% | 0.09% | 0.04% | 0.27% | -0.05% | 0.03% | 0.19% |
The heat map shows percentage changes of major currencies against each other. The base currency is picked from the left column, while the quote currency is picked from the top row. For example, if you pick the British Pound from the left column and move along the horizontal line to the US Dollar, the percentage change displayed in the box will represent GBP (base)/USD (quote).
Author

Akhtar Faruqui
FXStreet
Akhtar Faruqui is a Forex Analyst based in New Delhi, India. With a keen eye for market trends and a passion for dissecting complex financial dynamics, he is dedicated to delivering accurate and insightful Forex news and analysis.


