GBP/USD Price Forecast: Holds position above 1.3000 near five-month highs
- GBP/USD may target the immediate resistance at the five-month high at 1.3048.
- The 14-day RSI indicates an overbought situation and a potential downward correction.
- The primary support appears at a nine-day EMA of 1.2955.

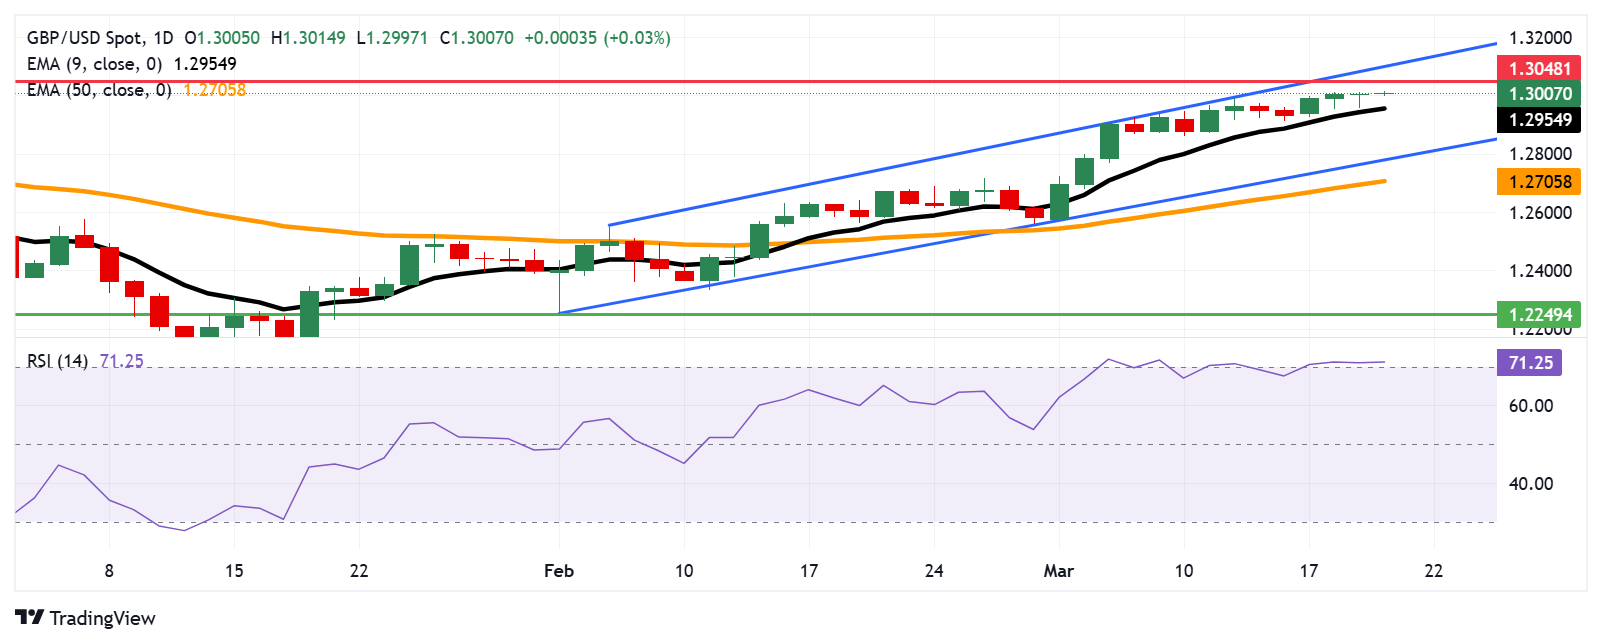
The GBP/USD pair remains in positive territory for the fourth successive session, trading around 1.3010 during the Asian hours on Thursday. Technical analysis of the daily chart indicates a continued bullish bias, with the pair moving upwards within an ascending channel pattern.
The 14-day Relative Strength Index (RSI) is slightly above 70, signaling strong bullish momentum but also suggesting that the GBP/USD pair is overbought, potentially leading to a downward correction.
Moreover, the GBP/USD pair continues to trade above the nine-day Exponential Moving Average (EMA), reinforcing strong short-term price dynamics and confirming the ongoing upward trend.
On the upside, the GBP/USD pair may challenge primary resistance at the five-month high at 1.3048, recorded on November 6, followed by the ascending channel’s upper boundary near 1.3090.
The GBP/USD pair is likely to find immediate support at the nine-day EMA of 1.2954. A break below this level could weaken short-term price momentum, potentially driving the pair toward the ascending channel’s lower boundary near 1.2770, followed by the 50-day EMA at 1.2705.
GBP/USD: Daily Chart
British Pound PRICE Today
The table below shows the percentage change of British Pound (GBP) against listed major currencies today. British Pound was the strongest against the New Zealand Dollar.
| USD | EUR | GBP | JPY | CAD | AUD | NZD | CHF | |
|---|---|---|---|---|---|---|---|---|
| USD | -0.06% | -0.02% | -0.21% | -0.01% | 0.20% | 0.33% | -0.19% | |
| EUR | 0.06% | 0.03% | -0.13% | 0.05% | 0.26% | 0.39% | -0.14% | |
| GBP | 0.02% | -0.03% | -0.17% | 0.00% | 0.23% | 0.36% | -0.16% | |
| JPY | 0.21% | 0.13% | 0.17% | 0.18% | 0.39% | 0.51% | 0.08% | |
| CAD | 0.00% | -0.05% | -0.00% | -0.18% | 0.21% | 0.36% | -0.18% | |
| AUD | -0.20% | -0.26% | -0.23% | -0.39% | -0.21% | 0.14% | -0.39% | |
| NZD | -0.33% | -0.39% | -0.36% | -0.51% | -0.36% | -0.14% | -0.55% | |
| CHF | 0.19% | 0.14% | 0.16% | -0.08% | 0.18% | 0.39% | 0.55% |
The heat map shows percentage changes of major currencies against each other. The base currency is picked from the left column, while the quote currency is picked from the top row. For example, if you pick the British Pound from the left column and move along the horizontal line to the US Dollar, the percentage change displayed in the box will represent GBP (base)/USD (quote).
Author

Akhtar Faruqui
FXStreet
Akhtar Faruqui is a Forex Analyst based in New Delhi, India. With a keen eye for market trends and a passion for dissecting complex financial dynamics, he is dedicated to delivering accurate and insightful Forex news and analysis.


