GBP/USD Price Forecast: Hits five-day peak above 1.3200
- GBP/USD nears 1.3239, with potential to test the YTD high at 1.3266 and March 2022 peaks.
- Bulls bought the dip at 1.3001, fueling the rally to current levels.
- Failure at 1.3200 could see a pullback towards 1.3150, with further downside risks at 1.3100 and 1.3044.

The Pound Sterling rallied in early trading during the North American session against the Greenback, registering gains of over 0.60% and hitting a five-day peak of 1.3214. At the time of writing, the GBP/USD trades at 1.3199.
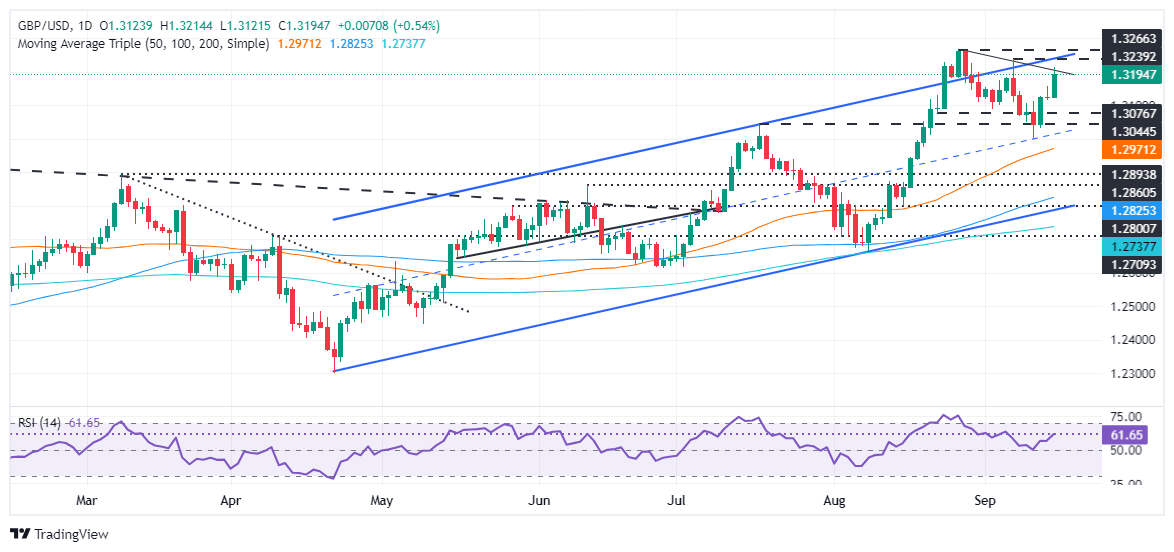
GBP/USD Price Forecast: Technical outlook
The GBP/USD has risen sharply, as bullish momentum picked up, as portrayed by the Relative Strength Index (RSI). In addition, bulls buying the dip at 1.3001 lifted spot prices to the current exchange rate.
Still, GBP/USD remains shy of testing the September 6 high of 1.3239. In that outcome, the next resistance level would be the year-to-date (YTD) high at 1.3266. Once surpassed, the daily high on March 23, 2022, would be up for grabs at 1.3298 before the pair hits the March 1, 2022, high at 1.3437.
Conversely, if GBP/USD stands below 1.3200, this could exacerbate a re-test of the 1.3100 figure. But firstly, sellers need to challenge 1.3150. Further losses lie at 1.3044, and the July 17 high turned support.
GBP/USD Price Action – Daily Chart
British Pound PRICE Today
The table below shows the percentage change of British Pound (GBP) against listed major currencies today. British Pound was the strongest against the US Dollar.
| USD | EUR | GBP | JPY | CAD | AUD | NZD | CHF | |
|---|---|---|---|---|---|---|---|---|
| USD | -0.42% | -0.54% | -0.21% | -0.02% | -0.48% | -0.41% | -0.31% | |
| EUR | 0.42% | -0.18% | 0.17% | 0.37% | -0.12% | -0.04% | 0.07% | |
| GBP | 0.54% | 0.18% | 0.28% | 0.54% | 0.06% | 0.15% | 0.26% | |
| JPY | 0.21% | -0.17% | -0.28% | 0.20% | -0.21% | -0.17% | -0.15% | |
| CAD | 0.02% | -0.37% | -0.54% | -0.20% | -0.54% | -0.40% | -0.40% | |
| AUD | 0.48% | 0.12% | -0.06% | 0.21% | 0.54% | 0.08% | 0.17% | |
| NZD | 0.41% | 0.04% | -0.15% | 0.17% | 0.40% | -0.08% | 0.11% | |
| CHF | 0.31% | -0.07% | -0.26% | 0.15% | 0.40% | -0.17% | -0.11% |
The heat map shows percentage changes of major currencies against each other. The base currency is picked from the left column, while the quote currency is picked from the top row. For example, if you pick the British Pound from the left column and move along the horizontal line to the US Dollar, the percentage change displayed in the box will represent GBP (base)/USD (quote).
Author

Christian Borjon Valencia
FXStreet
Markets analyst, news editor, and trading instructor with over 14 years of experience across FX, commodities, US equity indices, and global macro markets.


