- GBP/USD shows upward bias on daily chart, yet short-term RSI presents mixed signals.
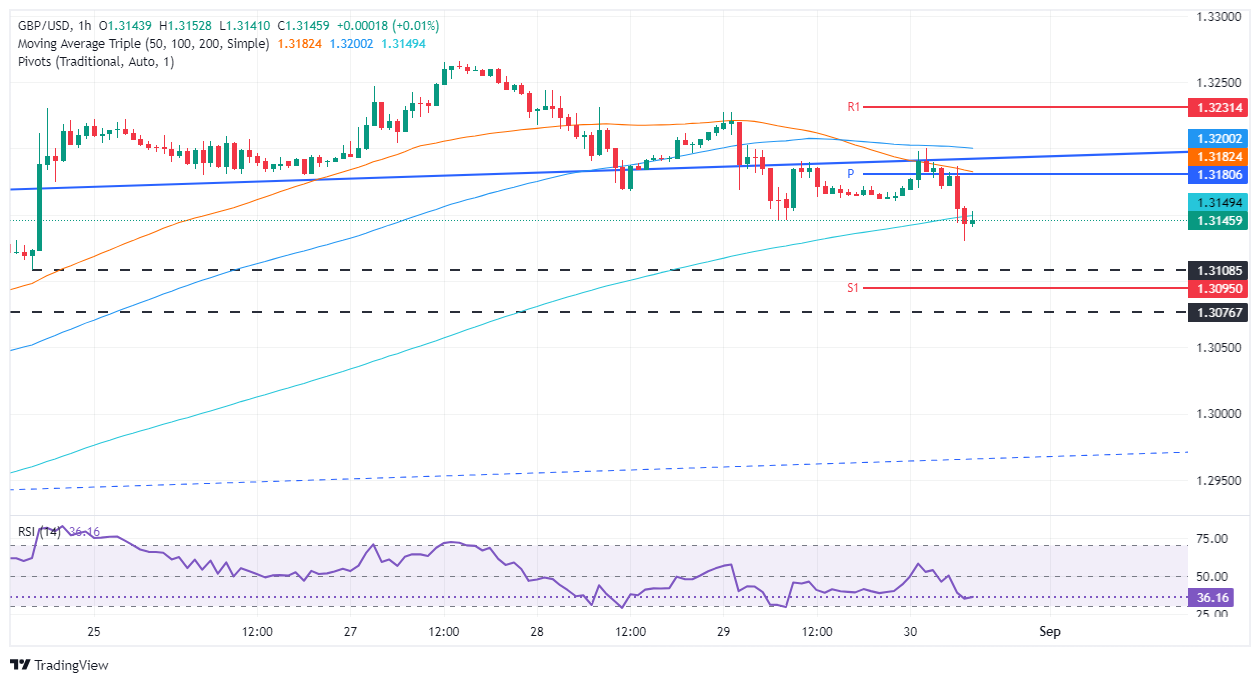
- Hourly chart reveals bearish trend with the pair below 50, 100, and 200-HMAs; sellers aim for 1.3108 and potentially 1.3100.
- Additional supports at August 22 low of 1.3076 and August 20 high of 1.3052.
- Buyers reclaiming 200-HMA at 1.3148 could push recovery to 1.3182 (50-HMA) and 1.3200.
The GBP/USD extends its losing streak to three days yet has bounced off daily/weekly lows of 1.3129 and exchanges hands at 1.3149, down a modest 0.14%. Data from the United States (US) spurred a leg-down in the currency pair as the Fed’s preferred gauge for inflation came as expected, hinting that the US Federal Reserve could cut rates at the upcoming September meeting.
GBP/USD Price Forecast: Technical outlook
Daily, the GBP/USD remains upward biased despite retreating toward the 1.3120 area. In the short term, sellers are in charge, as revealed by the Relative Strength Index (RSI), which is bullish but aiming lower and showing mixed readings.
Zooming into the hourly chart, the GBP/USD is bearishly biased, as the exchange rate remains below the 50, 100, and 200-hour moving averages (HMAs), with sellers eyeing last Friday's low of 1.3108. Once cleared could pave the way for testing the 1.3100 figure. A further downside is seen at the August 22 swing low of 1.3076, ahead of the August 20 high at 1.3052.
If GBP/USD buyers reclaim the 200-HMA at 1.3148, this could sponsor a recovery toward the 50-HMA at 1.3182 ahead of 1.3200.
GBP/USD Price Action – Hourly Chart
British Pound PRICE Today
The table below shows the percentage change of British Pound (GBP) against listed major currencies today. British Pound was the strongest against the Japanese Yen.
USD | EUR | GBP | JPY | CAD | AUD | NZD | CHF | |
---|---|---|---|---|---|---|---|---|
USD | 0.02% | 0.11% | 0.38% | -0.06% | 0.16% | -0.02% | 0.19% | |
EUR | -0.02% | 0.08% | 0.39% | -0.09% | 0.15% | -0.06% | 0.17% | |
GBP | -0.11% | -0.08% | 0.29% | -0.17% | 0.07% | -0.14% | 0.06% | |
JPY | -0.38% | -0.39% | -0.29% | -0.43% | -0.19% | -0.40% | -0.20% | |
CAD | 0.06% | 0.09% | 0.17% | 0.43% | 0.23% | 0.05% | 0.23% | |
AUD | -0.16% | -0.15% | -0.07% | 0.19% | -0.23% | -0.20% | 0.00% | |
NZD | 0.02% | 0.06% | 0.14% | 0.40% | -0.05% | 0.20% | 0.20% | |
CHF | -0.19% | -0.17% | -0.06% | 0.20% | -0.23% | -0.01% | -0.20% |
The heat map shows percentage changes of major currencies against each other. The base currency is picked from the left column, while the quote currency is picked from the top row. For example, if you pick the British Pound from the left column and move along the horizontal line to the US Dollar, the percentage change displayed in the box will represent GBP (base)/USD (quote).
Information on these pages contains forward-looking statements that involve risks and uncertainties. Markets and instruments profiled on this page are for informational purposes only and should not in any way come across as a recommendation to buy or sell in these assets. You should do your own thorough research before making any investment decisions. FXStreet does not in any way guarantee that this information is free from mistakes, errors, or material misstatements. It also does not guarantee that this information is of a timely nature. Investing in Open Markets involves a great deal of risk, including the loss of all or a portion of your investment, as well as emotional distress. All risks, losses and costs associated with investing, including total loss of principal, are your responsibility. The views and opinions expressed in this article are those of the authors and do not necessarily reflect the official policy or position of FXStreet nor its advertisers. The author will not be held responsible for information that is found at the end of links posted on this page.
If not otherwise explicitly mentioned in the body of the article, at the time of writing, the author has no position in any stock mentioned in this article and no business relationship with any company mentioned. The author has not received compensation for writing this article, other than from FXStreet.
FXStreet and the author do not provide personalized recommendations. The author makes no representations as to the accuracy, completeness, or suitability of this information. FXStreet and the author will not be liable for any errors, omissions or any losses, injuries or damages arising from this information and its display or use. Errors and omissions excepted.
The author and FXStreet are not registered investment advisors and nothing in this article is intended to be investment advice.
Recommended content
Editors’ Picks
EUR/USD loses the grip and challenges 1.0400
A robust, tariff-driven upswing in the US Dollar is now driving EUR/USD to deepen its daily losses, closing in on the key support at 1.0400 the figure ahead of scheduled speeches from Federal Reserve officials and President Trump.
GBP/USD keeps its offered bias around 1.2630 on USD buying
Following the lead of other risk-sensitive currencies, GBP/USD is giving way to renewed buying pressure on the Greenback, keeping the trade around 1.2630 ahead of remarks from Fed policymakers and President Trump.
Gold flirts with two-week lows around $2,880
Gold prices resume their downtrend and revisit two-week lows in the sub-$2,880 zone per ounce troy following the improved tone in the US Dollar, higher yields and further tariff narrative.
Bitcoin recovers above $85,000 while institutional investors offload their holdings
Bitcoin (BTC) recovers slightly and trades around $86,000 at the time of writing on Thursday after falling nearly 15% at one point this week. US President Donald Trump’s ongoing tariff news and falling institutional demand fueled the BTC’s correction.
February inflation: Sharp drop expected in France, stability in the rest of the Eurozone
Inflation has probably eased in February, particularly in France due to the marked cut in the regulated electricity price. However, this overall movement masks divergent trends. Although disinflation is becoming more widespread, prices continue to rise rapidly in services, in France as well as elsewhere in the Eurozone.
The Best brokers to trade EUR/USD
SPONSORED Discover the top brokers for trading EUR/USD in 2025. Our list features brokers with competitive spreads, fast execution, and powerful platforms. Whether you're a beginner or an expert, find the right partner to navigate the dynamic Forex market.