GBP/USD Price Forecast: Consolidates near weekly highs on Thanksgiving
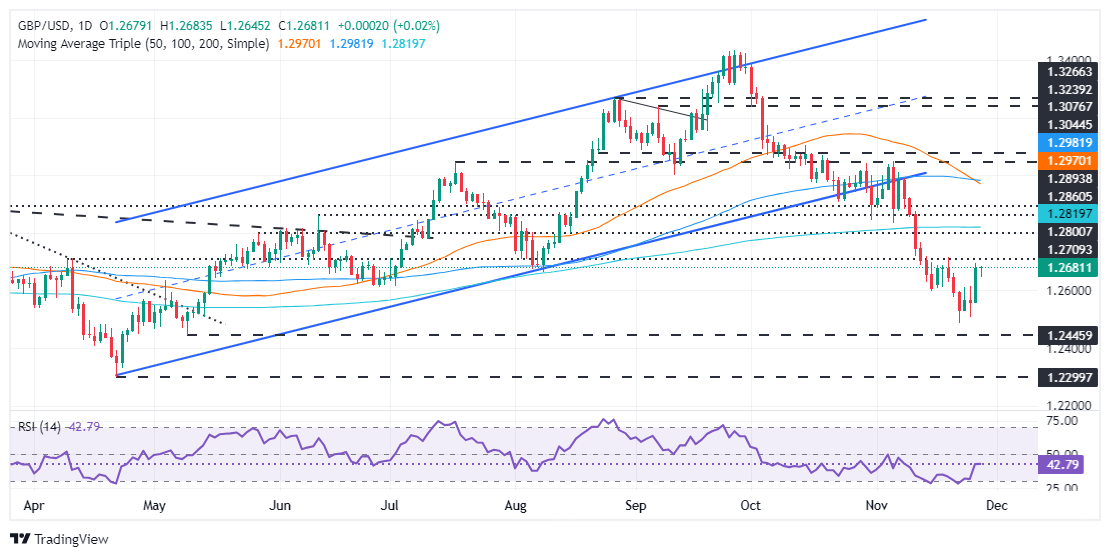
- GBP/USD maintains a downward trend but shows signs of short-term upward bias.
- Resistance levels to watch include 1.2714 and the 200-day SMA at 1.2818.
- Key supports lie at 1.2600 and further down at the November 26 low of 1.2506.
- Oscillators like the Relative Strength Index (RSI) hint at continued bearish sentiment despite a recent uptick

The GBP/USD consolidates at around weekly highs, posting modest losses of 0.05% at around 1.2670 due to thin liquidity conditions as US markets remain closed for Thanksgiving.
The Greenback has been pressured for the last few days due to month-end flows and rebalancing, noted ING. Although US data was upbeat on Wednesday, market participants digested Trump’s tariff rhetoric.
GBP/USD Price Forecast: Technical outlook
The GBP/USD trend remains downward biased, although the Pound has recovered some ground. If buyers want to regain control, first, they need to clear 1.2714, the November 20 high, followed by the 200-day Simple Moving Average (SMA) at 1.2818, which has turned flat. If those two resistance levels are surpassed, buyers' ride toward 1.3000 would not be easy after the 50-day SMA just crossed below the 100-day SMA and accelerated toward forming a ‘death-cross.’
Conversely, sellers must achieve a daily close below 1.2600 for a bearish continuation. A breach of the latter will expose the November 26 low of 1.2506, ahead of last week's low of 1.2486.
Oscillators such as the Relative Strength Index (RSI) remain bearish-biased despite rising for three straight days. The GBP/USD is tilted to the upside in the short term, but downside risks remain.
GBP/USD Price Chart – Daily
British Pound PRICE Today
The table below shows the percentage change of British Pound (GBP) against listed major currencies today. British Pound was the strongest against the Japanese Yen.
| USD | EUR | GBP | JPY | CAD | AUD | NZD | CHF | |
|---|---|---|---|---|---|---|---|---|
| USD | 0.11% | -0.01% | 0.23% | -0.04% | 0.03% | 0.19% | 0.13% | |
| EUR | -0.11% | -0.11% | 0.14% | -0.15% | -0.08% | 0.08% | 0.02% | |
| GBP | 0.01% | 0.11% | 0.25% | -0.02% | 0.04% | 0.19% | 0.13% | |
| JPY | -0.23% | -0.14% | -0.25% | -0.28% | -0.20% | -0.09% | -0.12% | |
| CAD | 0.04% | 0.15% | 0.02% | 0.28% | 0.08% | 0.22% | 0.16% | |
| AUD | -0.03% | 0.08% | -0.04% | 0.20% | -0.08% | 0.16% | 0.10% | |
| NZD | -0.19% | -0.08% | -0.19% | 0.09% | -0.22% | -0.16% | -0.07% | |
| CHF | -0.13% | -0.02% | -0.13% | 0.12% | -0.16% | -0.10% | 0.07% |
The heat map shows percentage changes of major currencies against each other. The base currency is picked from the left column, while the quote currency is picked from the top row. For example, if you pick the British Pound from the left column and move along the horizontal line to the US Dollar, the percentage change displayed in the box will represent GBP (base)/USD (quote).
Author

Christian Borjon Valencia
FXStreet
Markets analyst, news editor, and trading instructor with over 14 years of experience across FX, commodities, US equity indices, and global macro markets.


