- GBP/USD edges lower at the start of a new week amid a modest USD strength.
- The fundamental backdrop supports prospects for a further depreciating move.
- A slide towards the 1.2960 confluence support looks like a distinct possibility.
The GBP/USD pair struggles to capitalize on a two-day-old recovery move from the 1.2975 area, or a nearly two-month trough touched last Thursday and kicks off the new week on a softer note. Spot prices currently trade just below mid-1.3000s and seem vulnerable to prolonging the recent pullback from the 1.3435 region, or the highest level since March 2022.
The US Dollar (USD) attracts some dip-buyers at the start of a new week and reverses a part of Friday's losses amid expectations that the Federal Reserve (Fed) will proceed with modest rate cuts over the next year. The British Pound (GBP), on the other hand, is undermined by rising bets for interest rate cuts by the Bank of England (BoE) in November and December. This, in turn, adds credence to the near-term negative outlook for the GBP/USD pair.
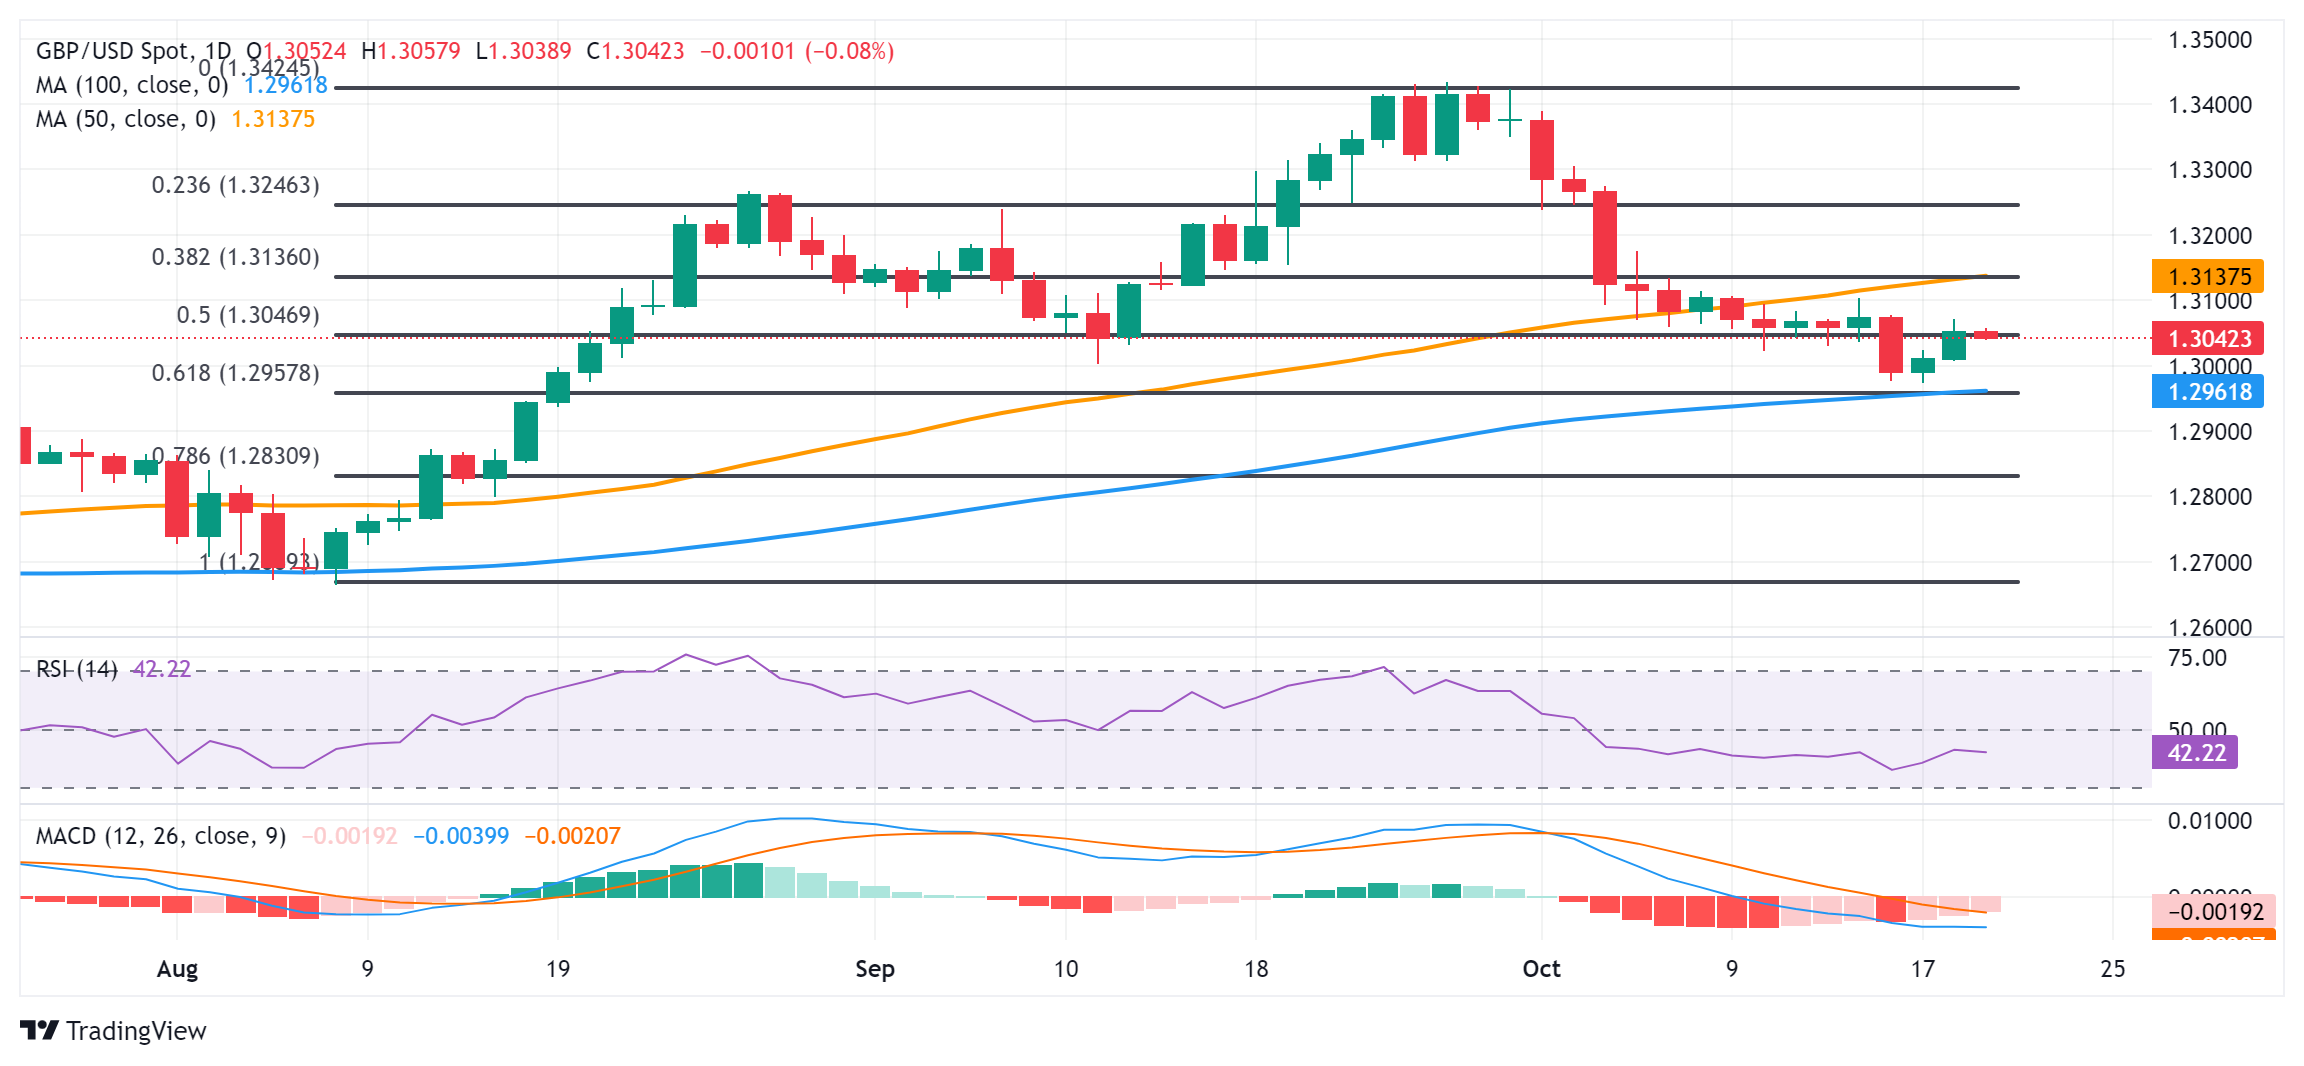
From a technical perspective, the recent breakdown through the 50-day Simple Moving Average (SMA) and the subsequent fall below the 50% Fibonacci retracement level of the August-September upswing was seen as a fresh trigger for bears. Furthermore, oscillators on the daily chart are holding in negative territory and are still away from being in the oversold territory, suggesting that the path of least resistance for the GBP/USD pair is to the downside.
Hence, some follow-through weakness back below the 1.3000 psychological mark, towards testing the 1.2960-1.2955 confluence support, looks like a distinct possibility. The latter comprises the 100-day SMA and the 61.8% Fibo. level, which if broken should pave the way for a slide towards the 1.2900 round figure en route to the 1.2860 horizontal support.
On the flip side, attempted recovery beyond the 1.3100 mark is likely to confront resistance near the 1.3135 region, or the 38.2% Fibo. level. The said hurdle now coincides with the 50-day SMA and should act as a key pivotal point. A sustained strength beyond might shift the bias in favor of bullish traders and allow the GBP/USD pair to reclaim the 1.3200 mark. The move up could extend further towards the 1.3250 strong horizontal support breakpoint.
GBP/USD daily chart
US Dollar PRICE Today
The table below shows the percentage change of US Dollar (USD) against listed major currencies today. US Dollar was the strongest against the Australian Dollar.
| USD | EUR | GBP | JPY | CAD | AUD | NZD | CHF | |
|---|---|---|---|---|---|---|---|---|
| USD | 0.05% | 0.08% | -0.16% | -0.01% | 0.14% | -0.02% | 0.08% | |
| EUR | -0.05% | -0.04% | -0.28% | -0.01% | 0.05% | -0.19% | -0.05% | |
| GBP | -0.08% | 0.04% | -0.23% | -0.09% | 0.07% | -0.11% | -0.05% | |
| JPY | 0.16% | 0.28% | 0.23% | 0.14% | 0.30% | 0.18% | 0.18% | |
| CAD | 0.01% | 0.00% | 0.09% | -0.14% | 0.06% | 0.05% | -0.04% | |
| AUD | -0.14% | -0.05% | -0.07% | -0.30% | -0.06% | -0.09% | -0.14% | |
| NZD | 0.02% | 0.19% | 0.11% | -0.18% | -0.05% | 0.09% | 0.05% | |
| CHF | -0.08% | 0.05% | 0.05% | -0.18% | 0.04% | 0.14% | -0.05% |
The heat map shows percentage changes of major currencies against each other. The base currency is picked from the left column, while the quote currency is picked from the top row. For example, if you pick the US Dollar from the left column and move along the horizontal line to the Japanese Yen, the percentage change displayed in the box will represent USD (base)/JPY (quote).
Information on these pages contains forward-looking statements that involve risks and uncertainties. Markets and instruments profiled on this page are for informational purposes only and should not in any way come across as a recommendation to buy or sell in these assets. You should do your own thorough research before making any investment decisions. FXStreet does not in any way guarantee that this information is free from mistakes, errors, or material misstatements. It also does not guarantee that this information is of a timely nature. Investing in Open Markets involves a great deal of risk, including the loss of all or a portion of your investment, as well as emotional distress. All risks, losses and costs associated with investing, including total loss of principal, are your responsibility. The views and opinions expressed in this article are those of the authors and do not necessarily reflect the official policy or position of FXStreet nor its advertisers. The author will not be held responsible for information that is found at the end of links posted on this page.
If not otherwise explicitly mentioned in the body of the article, at the time of writing, the author has no position in any stock mentioned in this article and no business relationship with any company mentioned. The author has not received compensation for writing this article, other than from FXStreet.
FXStreet and the author do not provide personalized recommendations. The author makes no representations as to the accuracy, completeness, or suitability of this information. FXStreet and the author will not be liable for any errors, omissions or any losses, injuries or damages arising from this information and its display or use. Errors and omissions excepted.
The author and FXStreet are not registered investment advisors and nothing in this article is intended to be investment advice.


Recommended content
Editors’ Picks

AUD/USD consolidates around 0.6400; remains close to YTD top
AUD/USD holds steady around the 0.6400 mark on Friday and remains well within striking distance of the YTD peak touched earlier this week. A positive risk tone, along with the potential for a de-escalation in the US-China trade war, act as a tailwind for the Aussie amid a bank holiday in Australia and the lack of any meaningful USD buying.

USD/JPY edges higher to 143.00 mark despite strong Tokyo CPI print
USD/JPY attracts some dip-buyers following Thursday's pullback from a two-week high as hopes for an eventual US-China trade deal tempers demand for the JPY. Data released this Friday showed that core inflation in Tokyo accelerated sharply in April, bolstering bets for more rate hikes by the BoJ.

Gold eyes US-China trade talks and third straight weekly gain
Gold price holds Thursday’s rebound, defending weekly gains near $3,350 early Friday. Gold buyers catch a breather, taking stock of the trade developments globally after US President Donald Trump’s tariffs whiplash.

TON Foundation appoints new CEO after $400M investment: Will Toncoin price reach $5 in 2025?
TON Foundation has appointed Maximilian Crown, co-founder of MoonPay, as its new CEO. Toncoin price remained muted, consolidating with a tight 2% range between $3.08 and $3.21 on Thursday.

Five fundamentals for the week: Traders confront the trade war, important surveys, key Fed speech Premium
Will the US strike a trade deal with Japan? That would be positive progress. However, recent developments are not that positive, and there's only one certainty: headlines will dominate markets. Fresh US economic data is also of interest.

The Best brokers to trade EUR/USD
SPONSORED Discover the top brokers for trading EUR/USD in 2025. Our list features brokers with competitive spreads, fast execution, and powerful platforms. Whether you're a beginner or an expert, find the right partner to navigate the dynamic Forex market.