|

GBP/USD Price Analysis: Tumbles below crucial 1.2500 as bears move in

  • GBP/USD drops 0.30%, US Dollar rises on positive US trade and labor data.
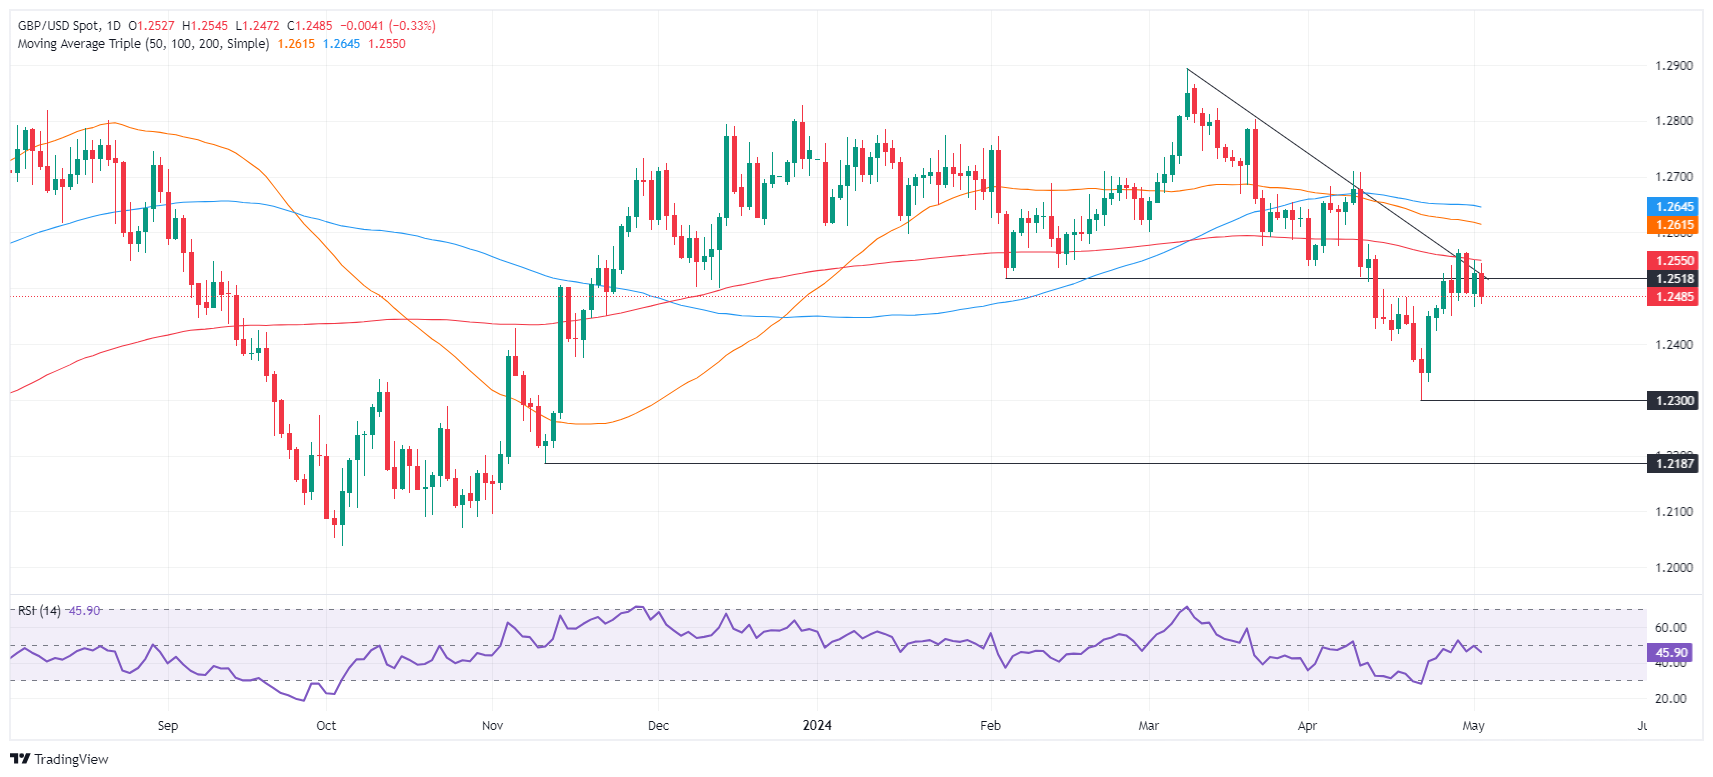
  • The GBP/USD struggles below 200-DMA at 1.2550, trending down.
  • RSI indicates bearish momentum; sellers control the market.
  • Recovery above 1.2500 could retest 200-DMA, with resistance at 1.2569 and 50-DMA at 1.2613.

The Pound Sterling tumbled in early trading during the North American session, dropping below the 1.2500 figure amid renewed US Dollar strength. Data from the United States showed that the Balance of Trade deficit tightened while the labor market remained tight, as revealed by the Initial Jobless Claims report. The GBP/USD trades at 1.2488, down 0.30%.

GBP/USD Price Analysis: Technical outlook

From a technical standpoint, the GBP/USD is showing a neutral to downward bias. This is a result of buyers failing to breach the significant resistance at the 200-day moving average (DMA) at 1.2550. This failure has further intensified the major’s drop below the 1.2500 figure, potentially paving the way for a test of the latest cycle low seen at 1.2299, the April 22 low.

Momentum points to a continuation of the downtrend, as the Relative Strength Index (RSI) turned bearish on April 30. As of writing, it aims downward, meaning sellers remain in charge.

On the other hand, if buyers reclaim 1.2500, they must reclaim the 200-DMA ahead of testing the April 29 high at 1.2569. Once cleared, the next stop would be the 1.2600 mark, followed by the 50-DMA at 1.2613. Further gains are seen above the 100-DMA at 1.2644.

GBP/USD Price Action – Daily Chart

GBP/USD

Overview
Today last price1.2481
Today Daily Change-0.0045
Today Daily Change %-0.36
Today daily open1.2526
 
Trends
Daily SMA201.2507
Daily SMA501.2618
Daily SMA1001.2648
Daily SMA2001.2551
 
Levels
Previous Daily High1.255
Previous Daily Low1.2466
Previous Weekly High1.2542
Previous Weekly Low1.23
Previous Monthly High1.2709
Previous Monthly Low1.23
Daily Fibonacci 38.2%1.2518
Daily Fibonacci 61.8%1.2498
Daily Pivot Point S11.2479
Daily Pivot Point S21.2431
Daily Pivot Point S31.2395
Daily Pivot Point R11.2562
Daily Pivot Point R21.2598
Daily Pivot Point R31.2646

Author

Christian Borjon Valencia

Markets analyst, news editor, and trading instructor with over 14 years of experience across FX, commodities, US equity indices, and global macro markets.

More from Christian Borjon Valencia
Share:

Editor's Picks

EUR/USD slumps below 1.1750 as USD benefits from risk-aversion

EUR/USD comes under renewed bearish pressure in the European session and trades below 1.1750 following a recovery attempt earlier in the day. The US Dollar gathers strength and weighs on the pair as investors seek refuge in the wake of Israel and the United States' joint attack on Iran.

GBP/USD targets 1.3500 barrier near moving averages

GBP/USD rebounds from the daily losses, trading around 1.3450 during the Asian hours on Monday. The technical analysis of the daily chart indicates an ongoing bearish bias, as the pair trades within a descending channel pattern.

Gold surges on safe-haven demand, rises above $5,400

Gold benefits from intense risk-aversion on Monday and climbs above $5,400, setting a fresh monthly-high in the process. Tensions in the Middle East remain high as Israel and Hezbollah continue to exchange strikes following the US-Israel joint attack on Iran over the weekend.

Bitcoin, Ethereum and Ripple under pressure as key supports face breakdown risk

Bitcoin, Ethereum, and Ripple prices trade on the back foot at the start of this week on Monday, after extending losses in the previous week. BTC is on the brink of a breakdown, ETH is capped below key resistance, and XRP risks a crack of the trendline.

The market is paying for insurance, not apocalypse

As expected, this morning felt less like a Monday market open and more like a fire drill. Futures screens flickered red. S&P contracts down almost 1%. Nasdaq off 1.2%. Brent leaped 13% through $80. Gold rose 1.6% toward $5350 before paring some gains. The dollar is strutting mildly. The Swiss franc is quietly doing what it always does in a storm, catching some safe-haven flows.

Pi Network Price Forecast: Core team offloads supply, weighing on PI recovery

Pi Network  hovers below $0.1700, broadly steady at press time on Monday, attempting a recovery after a 2% loss the previous day. Sunday’s decline aligned with nearly 49 million PI tokens offloaded by the Pi Foundation, implying a spike in supply pressure that capped the prevailing four-day recovery.