GBP/USD Price Analysis: Stuck in range, clings to 1.2900
- GBP/USD remains subdued around 1.2900, bouncing off daily lows of 1.2877.
- Sellers failed to achieve a daily close below 1.2900, but momentum favors further losses.
- Key support levels at 1.2860 and 1.2779, with downside potential toward 100-DMA at 1.2678 if breached.

The Pound Sterling clings to minimal gains, though it remains stuck within the 1.2880-1.2940 range against the Greenback, unable to crack immediate resistance to push the GBP/USD pair toward the 1.3000 mark. At the time of writing, the major trades at 1.2926 after bouncing off daily lows of 1.2877.
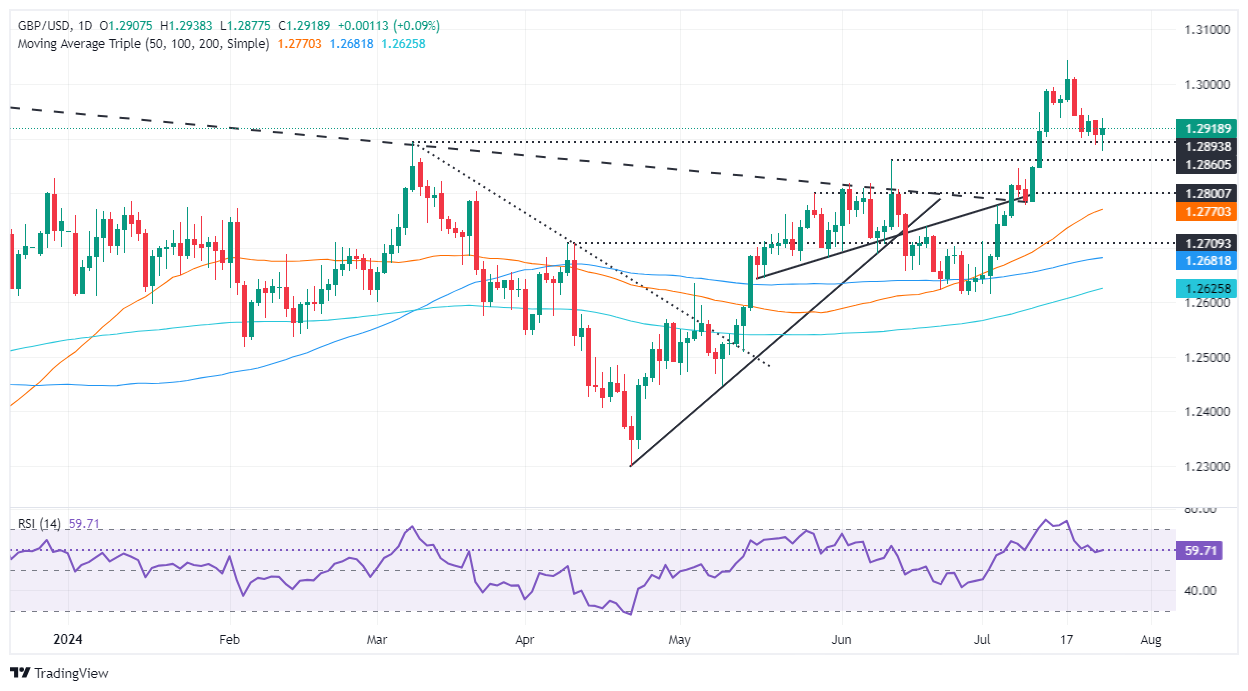
GBP/USD Price Analysis: Technical outlook
The pair remained subdued for the fourth straight day, glued at around 1.2900; even though UK PMI data was stronger than expected, the pair failed to gain traction. Conversely, sellers pushed the GBP/USD three times below 1.2900 but failed to achieve a daily close below the latter, which could pave the way for a deeper pullback.
According to the Relative Strength Index (RSI), buyers have the edge from a momentum standpoint, but in the near term, sellers have moved in as the RSI slope aims downwards.
Hence, the GBP/USD could extend its losses. They will face key resistance at 1.2900 followed by the June 12 high at 1.2860. Once those levels are taken out, the next demand area will be the July 10 low at 1.2779, with further downside seen at the 100-day moving average (DMA) at 1.2678.
Conversely, if buyers lift the exchange rate past 1.2940, the next resistance would be 1.3000.
GBP/USD Price Action – Daily Chart
Pound Sterling FAQs
The Pound Sterling (GBP) is the oldest currency in the world (886 AD) and the official currency of the United Kingdom. It is the fourth most traded unit for foreign exchange (FX) in the world, accounting for 12% of all transactions, averaging $630 billion a day, according to 2022 data. Its key trading pairs are GBP/USD, aka ‘Cable’, which accounts for 11% of FX, GBP/JPY, or the ‘Dragon’ as it is known by traders (3%), and EUR/GBP (2%). The Pound Sterling is issued by the Bank of England (BoE).
The single most important factor influencing the value of the Pound Sterling is monetary policy decided by the Bank of England. The BoE bases its decisions on whether it has achieved its primary goal of “price stability” – a steady inflation rate of around 2%. Its primary tool for achieving this is the adjustment of interest rates. When inflation is too high, the BoE will try to rein it in by raising interest rates, making it more expensive for people and businesses to access credit. This is generally positive for GBP, as higher interest rates make the UK a more attractive place for global investors to park their money. When inflation falls too low it is a sign economic growth is slowing. In this scenario, the BoE will consider lowering interest rates to cheapen credit so businesses will borrow more to invest in growth-generating projects.
Data releases gauge the health of the economy and can impact the value of the Pound Sterling. Indicators such as GDP, Manufacturing and Services PMIs, and employment can all influence the direction of the GBP. A strong economy is good for Sterling. Not only does it attract more foreign investment but it may encourage the BoE to put up interest rates, which will directly strengthen GBP. Otherwise, if economic data is weak, the Pound Sterling is likely to fall.
Another significant data release for the Pound Sterling is the Trade Balance. This indicator measures the difference between what a country earns from its exports and what it spends on imports over a given period. If a country produces highly sought-after exports, its currency will benefit purely from the extra demand created from foreign buyers seeking to purchase these goods. Therefore, a positive net Trade Balance strengthens a currency and vice versa for a negative balance.
British Pound PRICE Today
The table below shows the percentage change of British Pound (GBP) against listed major currencies today. British Pound was the strongest against the New Zealand Dollar.
| USD | EUR | GBP | JPY | CAD | AUD | NZD | CHF | |
|---|---|---|---|---|---|---|---|---|
| USD | 0.00% | -0.08% | -1.49% | 0.03% | 0.14% | 0.17% | -0.82% | |
| EUR | -0.01% | -0.09% | -1.50% | 0.02% | 0.16% | 0.17% | -0.83% | |
| GBP | 0.08% | 0.09% | -1.41% | 0.11% | 0.24% | 0.26% | -0.76% | |
| JPY | 1.49% | 1.50% | 1.41% | 1.56% | 1.66% | 1.67% | 0.67% | |
| CAD | -0.03% | -0.02% | -0.11% | -1.56% | 0.11% | 0.15% | -0.87% | |
| AUD | -0.14% | -0.16% | -0.24% | -1.66% | -0.11% | 0.01% | -0.99% | |
| NZD | -0.17% | -0.17% | -0.26% | -1.67% | -0.15% | -0.01% | -1.01% | |
| CHF | 0.82% | 0.83% | 0.76% | -0.67% | 0.87% | 0.99% | 1.01% |
The heat map shows percentage changes of major currencies against each other. The base currency is picked from the left column, while the quote currency is picked from the top row. For example, if you pick the British Pound from the left column and move along the horizontal line to the US Dollar, the percentage change displayed in the box will represent GBP (base)/USD (quote).
Author

Christian Borjon Valencia
FXStreet
Markets analyst, news editor, and trading instructor with over 14 years of experience across FX, commodities, US equity indices, and global macro markets.


