|

GBP/USD Price Analysis: Struggles to find acceptance above 100-hour SMA

  • GBP/USD struggled to capitalize on the intraday positive move beyond 100-hour SMA.
  • Neutral technical set-up warrants caution before placing any aggressive directional bets.

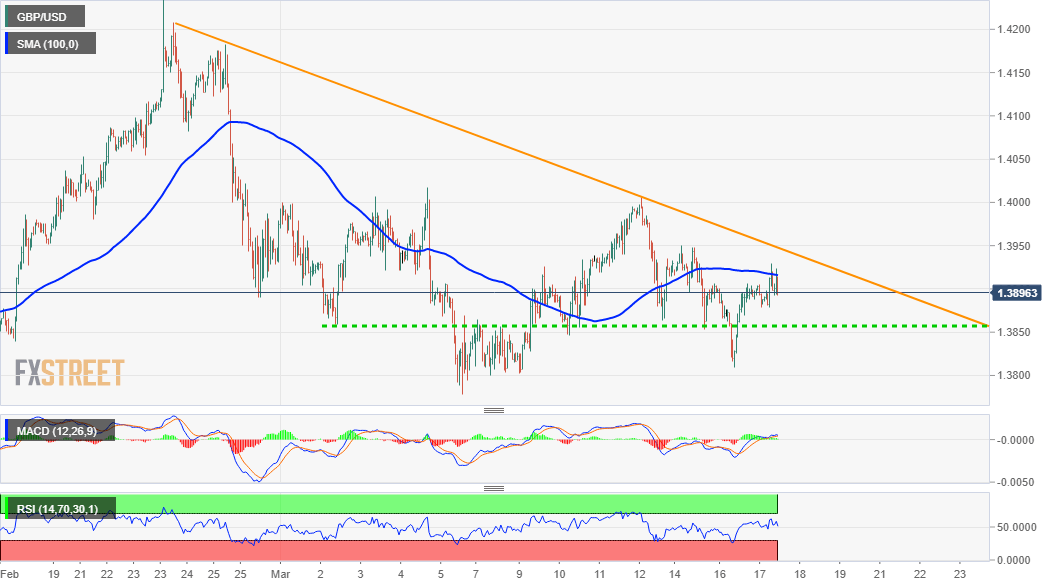
The GBP/USD pair gained some positive traction on Tuesday and built on the previous day's solid bounce from the vicinity of the 1.3800 mark or weekly lows. The pair jumped back above the 1.3900 mark, albeit failed to capitalize on the momentum or find acceptance above 100-hour SMA.

Any subsequent move up is likely to confront a stiff resistance near a short-term descending trend-line extending from near three-year tops touched on February 24. The mentioned barrier is pegged near the 1.3940-50 region and should now act as a key pivotal point for short-term traders.

Meanwhile, technical indicators on hourly/daily charts have been struggling to gain meaningful traction but are holding just above the positive territory. That said, the lack of any follow-through buying warrants some caution for bullish traders ahead of the critical FOMC monetary policy decision.

This, in turn, makes it prudent to wait for a sustained move beyond the trend-line resistance before confirming that the recent corrective fall has run its course and positioning for any further gains. The GBP/USD pair might then make a fresh attempt to conquer the 1.4000 psychological mark.

A subsequent strength beyond the monthly swing highs, around the 1.4015 region has the potential to push the GBP/USD pair to the 1.4060-65 intermediate hurdle en-route the 1.4100 mark. The momentum could further get extended towards the recent daily closing highs, around the 1.4135-40 region.

On the flip side, any meaningful slide below the 1.3900 mark is likely to find some support near mid-1.3800s. This is followed by the overnight swing lows, around the 1.3810 region, which if broken decisively will set the stage for an extension of the recent corrective slide from multi-year tops.

GBP/USD 1-hourly chart

fxsoriginal

Technical levels to watch

GBP/USD

Overview
Today last price1.3904
Today Daily Change0.0012
Today Daily Change %0.09
Today daily open1.3892
 
Trends
Daily SMA201.3951
Daily SMA501.3798
Daily SMA1001.3564
Daily SMA2001.3215
 
Levels
Previous Daily High1.3906
Previous Daily Low1.3809
Previous Weekly High1.4005
Previous Weekly Low1.38
Previous Monthly High1.4243
Previous Monthly Low1.3566
Daily Fibonacci 38.2%1.3846
Daily Fibonacci 61.8%1.3869
Daily Pivot Point S11.3832
Daily Pivot Point S21.3772
Daily Pivot Point S31.3735
Daily Pivot Point R11.3929
Daily Pivot Point R21.3966
Daily Pivot Point R31.4026

Author

Haresh Menghani

Haresh Menghani is a detail-oriented professional with 10+ years of extensive experience in analysing the global financial markets.

More from Haresh Menghani
Share:

Editor's Picks

EUR/USD retreats below 1.1800 following earlier rebound

EUR/USD loses its recovery momentum and trades little-changed on the day below 1.1300 in the second half of the day on Wednesday. The modest improvement seen in risk mood limits the US Dollar's gains and allows the pair to hold its ground.

GBP/USD clings to small gains above 1.3500

GBP/USD is posting moderate gains above 1.3500 on Wednesday. The pair edges higher as the US Dollar meets fresh supply amid a modest improvement seen in risk sentiment following US President Donald Trump’s first State of the Union address.

Gold rises toward $5,200, supported by geopolitics and trade jitters

Gold buyers are back in the game, eyeing $5,200 and beyonf on Wednesday after seeing a correction from monthly highs on Tuesday. The US Dollar slips after Trump’s SOTU fails to impress and as AI-driven worries ease. Dovish Fed bets also weigh.  Gold looks north so long as the key 61.8% Fibo resistance at $5,142 holds on the daily chart.

Bitcoin, Ethereum and Ripple post cautious recovery amid downside risks

Bitcoin, Ethereum, and Ripple are posting a cautious recovery on Wednesday following a market correction earlier this week.  BTC is approaching a key breakdown level, while ETH and XRP are rebounding from crucial support levels.

Nvidia remains at the heart of the AI boom

Nvidia remains at the heart of the AI boom, with Q4 revenue projected near $65.6–66.1 billion, nearly 70% higher year-over-year. But investors are watching cash flow, leverage, and broader AI adoption. Growth is strong, but the AI stress isn’t over.

Cosmos Hub Price Forecast: ATOM rebounds slightly, bearish outlook remains intact

Cosmos Hub (ATOM) price rebounds, trading above $2.05 at the time of writing on Wednesday, after undergoing a sharp correction since last week. Weakening on-chain and derivatives data support a bearish outlook, while technical analysis remains unfavorable.