|

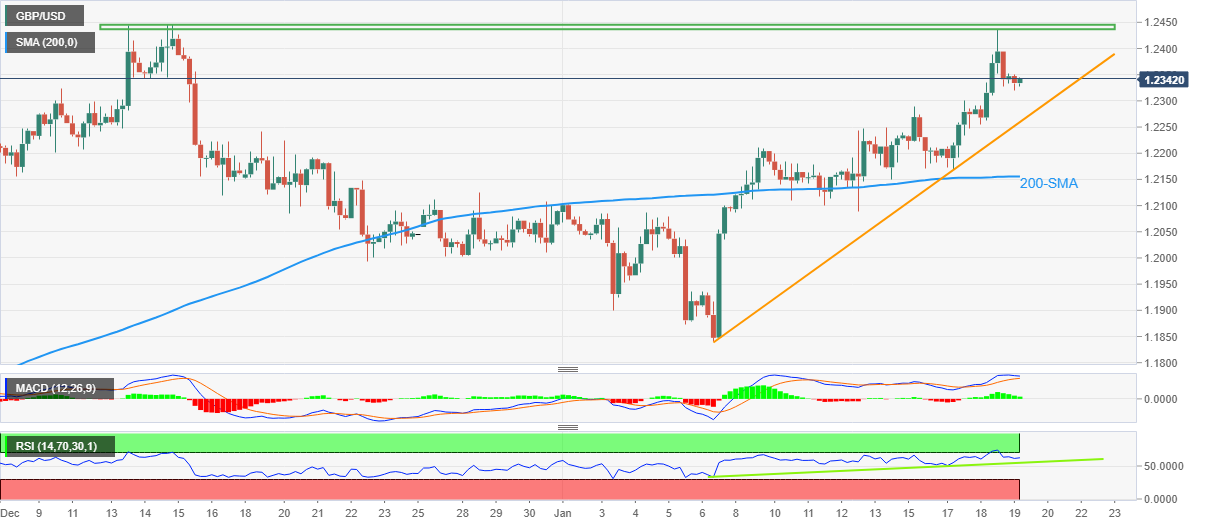
GBP/USD Price Analysis: Steadies above 1.2300 inside key trading zone

  • GBP/USD treads water as bulls and bears jostle between crucial resistance and support.
  • Looming bear cross on MACD, failure to cross 1.2450 hurdle tease sellers.
  • Two-week-old ascending trend line, 200-SMA limit downside moves.
  • RSI conditions suggest further grinding towards the north.

GBP/USD struggles for clear directions as it floats around 1.2330 amid the initial hour of London open on Thursday. In doing so, the Cable pair trades within an important trading region amid contrasting oscillators.

That said, a five-week-old horizontal resistance area restricts the GBP/USD pair’s immediate upside to around 1.2450 while an ascending trend line from January 06, close to 1.2260 at the latest, challenges the bears.

It’s worth noting that the MACD signals are losing the bullish bias but the RSI (14) defends the two-week-old bullish bias despite the latest retreat.

In addition to the 1.2260 support, the 200-SMA level surrounding 1.2155 and the 1.2000 psychological magnet also challenge the GBP/USD sellers, making it harder for them to retake control.

Should the quote drops below the 1.2000 mark, a south-run to refresh the monthly low, currently around 1.1841, can’t be ruled out.

Alternatively, an upside break of 1.2450 will confirm the “rounding bottom” bullish chart pattern that theoretically suggests a rally towards 1.3050.

However, the May 2022 high of 1.2665 and the late April 2022 low of 1.2975 could act as additional upside filters to challenge the GBP/USD buyers during the aforementioned rally.

GBP/USD: Four-hour chart

Trend: Sideways

Additional important levels

Overview
Today last price1.2338
Today Daily Change0.0000
Today Daily Change %0.00%
Today daily open1.2338
 
Trends
Daily SMA201.2108
Daily SMA501.2086
Daily SMA1001.1707
Daily SMA2001.1985
 
Levels
Previous Daily High1.2436
Previous Daily Low1.2255
Previous Weekly High1.2249
Previous Weekly Low1.2086
Previous Monthly High1.2447
Previous Monthly Low1.1992
Daily Fibonacci 38.2%1.2367
Daily Fibonacci 61.8%1.2324
Daily Pivot Point S11.225
Daily Pivot Point S21.2162
Daily Pivot Point S31.2068
Daily Pivot Point R11.2431
Daily Pivot Point R21.2524
Daily Pivot Point R31.2613

Author

Anil Panchal

Anil Panchal

FXStreet

Anil Panchal has nearly 15 years of experience in tracking financial markets. With a keen interest in macroeconomics, Anil aptly tracks global news/updates and stays well-informed about the global financial moves and their implications.

More from Anil Panchal
Share:

Markets move fast. We move first.

Orange Juice Newsletter brings you expert driven insights - not headlines. Every day on your inbox.

By subscribing you agree to our Terms and conditions.

Editor's Picks

EUR/USD stays defensive below 1.1750 as USD finds its feet

EUR/USD kicks off the new week on a softer note, holding below 1.1750 in European trading on Monday. The pair faces challenges due to a pause in the US Dollar downtrend, with traders shifting their focus to the delayed US Nonfarm Payrolls and CPI data for fresh directives. The ECB policy decision is also eagerly awaited. 

GBP/USD holds steady above 1.3350 as traders await key data and BoE

GBP/USD remains on the back foot above 1.3350 in the European session on Monday, though it lacks bearish conviction and holds above the key 200-day SMA support. The US Dollar holds its recovery mode ahead of key data releases, while the Pound Sterling faces headwinds from the expected BoE rate cut this week. 

Gold climbs to seven-week highs on Fed rate cut bets, safe-haven demand

Gold price rises to seven-week highs to near $4,350 during the early European trading hours on Monday. The precious metal extends its upside amid the prospect of interest rate cuts by the US Fed next year. Lower interest rates could reduce the opportunity cost of holding Gold, supporting the non-yielding precious metal.

Solana consolidates as spot ETF inflows near $1 billion signal institutional dip-buying

Solana price hovers above $131 at the time of writing on Monday, nearing the upper boundary of a falling wedge pattern, awaiting a decisive breakout. On the institutional side, demand for spot Solana Exchange-Traded Funds remained firm, pushing total assets under management to nearly $1 billion since launch. 

Big week ends with big doubts

The S&P 500 continued to push higher yesterday as the US 2-year yield wavered around the 3.50% mark following a Federal Reserve (Fed) rate cut earlier this week that was ultimately perceived as not that hawkish after all. The cut is especially boosting the non-tech pockets of the market.

Solana Price Forecast: SOL consolidates as spot ETF inflows near $1 billion signal institutional dip-buying

Solana (SOL) price hovers above $131 at the time of writing on Monday, nearing the upper boundary of a falling wedge pattern, awaiting a decisive breakout.