|

GBP/USD Price Analysis: Slides back below 1.2000, seems poised to challenge 200-day SMA

  • GBP/USD comes under renewed selling pressure on Thursday and refreshes the weekly low.
  • The emergence of fresh USD buying turns out to be a key factor dragging spot prices lower.
  • The technical setup favours bearish traders and supports prospects for a further downfall.

The GBP/USD pair attracts fresh selling following an intraday move up to the 1.2075 area and drops to a fresh daily low during the early North American session. The pair slips back below the 1.2000 psychological mark in the last hour and is now seen flirting with the weekly low touched on Wednesday.

The prospects for further policy tightening by the Fed, along with the risk-off impulse, assist the safe-haven US Dollar to recover a major part of its intraday losses. Furthermore, expectations that the Bank of England's (BoE) current rate-hiking cycle is nearing the end continue to undermine the British Pound and act as a headwind for the GBP/USD pair.

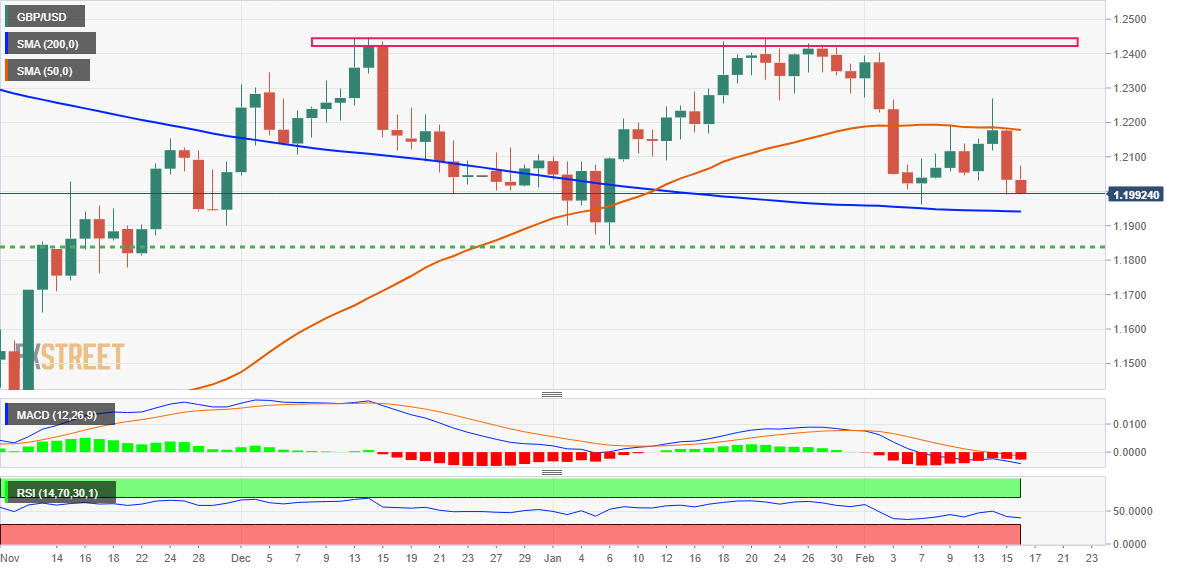
From a technical perspective, spot prices this week struggled to find acceptance above the 50-day SMA and the overnight slump suggests that the near-term downtrend is still far from being over. The outlook is reinforced by the fact that oscillators on the daily chart are holding in the bearish territory and are still far from being in the oversold zone.

Hence, a subsequent slide towards challenging the very important 200-day SMA, currently around the 1.1940-1.1935 region, looks like a distinct possibility. Against the backdrop of a double-top formation near the 1.2445-1.2450 region, some follow-through selling will confirm a fresh bearish breakdown and set the stage for a further depreciating move.

The GBP/USD pair might then turn vulnerable to weaken further below the 1.1900 round-figure mark and accelerate the slide towards retesting the YTD low, around the 1.1840 region touched in January.

On the flip side, the 1.2060-1.2070 region now seems to act as an immediate hurdle ahead of the 1.2100 mark and the 1.2125-1.2130 horizontal zone. This is followed by the 50-day SMA, around the 1.2175 area, above which a fresh bout of a short-covering could lift the GBP/USD pair beyond the 1.2200 mark, towards the 1.2265-1.2270 region, or the weekly high.

GBP/USD daily chart

fxsoriginal

Key levels to watch

GBP/USD

Overview
Today last price1.2013
Today Daily Change-0.0021
Today Daily Change %-0.17
Today daily open1.2034
 
Trends
Daily SMA201.2234
Daily SMA501.2183
Daily SMA1001.1885
Daily SMA2001.1942
 
Levels
Previous Daily High1.2182
Previous Daily Low1.199
Previous Weekly High1.2194
Previous Weekly Low1.1961
Previous Monthly High1.2448
Previous Monthly Low1.1841
Daily Fibonacci 38.2%1.2063
Daily Fibonacci 61.8%1.2108
Daily Pivot Point S11.1955
Daily Pivot Point S21.1876
Daily Pivot Point S31.1762
Daily Pivot Point R11.2147
Daily Pivot Point R21.2261
Daily Pivot Point R31.2339

Author

Haresh Menghani

Haresh Menghani is a detail-oriented professional with 10+ years of extensive experience in analysing the global financial markets.

More from Haresh Menghani
Share:

Markets move fast. We move first.

Orange Juice Newsletter brings you expert driven insights - not headlines. Every day on your inbox.

By subscribing you agree to our Terms and conditions.

Editor's Picks

EUR/USD steadies near 1.1750 ahead of final Eurozone CPI amid fading USD recovery

The EUR/USD pair steadies around the 1.1750 area during the Asian session on Wednesday, and for now, seems to have stalled the previous day's sharp retracement slide from the highest level since September 24. Meanwhile, the fundamental backdrop remains tilted in favor of bullish traders and suggests that the path of least resistance for spot prices remains to the upside.

GBP/USD gains ground above 1.3400 on UK PMI optimism

The GBP/USD pair gains momentum to around 1.3425 during the early Asian session on Wednesday. The Pound Sterling edges higher against the Greenback on the upbeat UK preliminary S&P Global Purchasing Managers' Index data. Traders will take more cues from the Fedspeak later on Wednesday. 

Gold extends the range play around $4,300

Gold edges higher during the Asian session on Wednesday, though it remains confined in a multi-day-old trading range. Dovish Fed-inspired bearish sentiment surrounding the US Dollar, along with the risk-off mood, acts as a tailwind for the safe-haven bullion. However, hopes for a Russia-Ukraine peace deal hold back the XAU/USD bulls from placing aggressive bets. Traders also seem reluctant ahead of the crucial US consumer inflation figures on Thursday.

XRP dips as bearish pressure persists despite ETF growth

Ripple is finding footing above $1.90 at the time of writing on Tuesday after a bearish wave swept across the broader cryptocurrency market, building on persistent negative sentiment.

Ukraine-Russia in the spotlight once again

Since the start of the week, gold’s price has moved lower, but has yet to erase the gains made last week. In today’s report we intend to focus on the newest round of peace talks between Russia and Ukraine, whilst noting the release of the US Employment data later on day and end our report with an update in regards to the tensions brewing in Venezuela.

BNB Price Forecast: BNB slips below $855 as bearish on-chain signals and momentum indicators turn negative

BNB, formerly known as Binance Coin, continues to trade down around $855 at the time of writing on Tuesday, after a slight decline the previous day. Bearish sentiment further strengthens as BNB’s on-chain and derivatives data show rising retail activity.