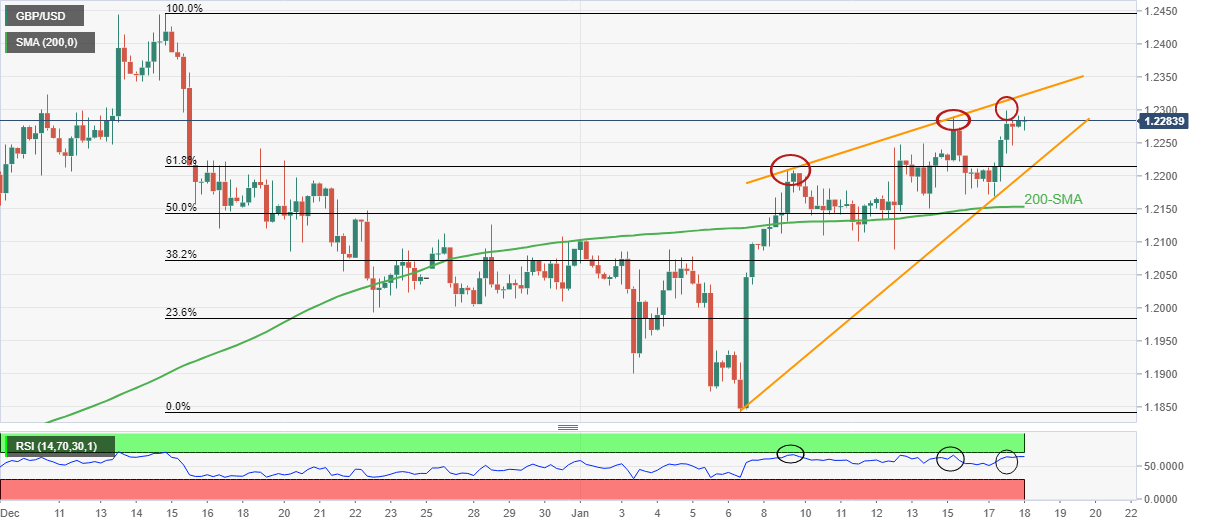
- GBP/USD grinds near five-week high inside bearish chart formation.
- Divergence between higher-high on prices and lower high on RSI (14) tease sellers.
- Upside break of 1.2345 could defy the bearish signals and challenge previous monthly top.
- UK Inflation may disappoint pair buyers amid mixed forecasts.
GBP/USD picks up bids to defend the previous day’s run-up around the 1.2300 round figure, despite posting only 0.08% intraday gains, as the Cable pair traders await the UK’s key inflation data on early Wednesday. Even so, the quote stays inside an eight-day-old rising wedge bearish chart formation.
Not only the rising wedge but bearish RSI (14) divergence also keeps the GBP/USD sellers hopeful. That said, the oscillator’s inability to back the higher-high on prices portrays the bearish RSI divergence.
However, the quote’s current upside could lure GBP/USD buyers if the scheduled UK data offers a positive surprise and allow the pair to cross the stated wedge’s upper line, close to 1.2325 by the press time.
Following that, the mid-December 2022 low around 1.2345 may probe GBP/USD bulls before directing them toward the previous monthly peak surrounding 1.2445.
Alternatively, pullback moves need validation from the 200-SMA level of 1.2153 while the aforementioned wedge’s lower line, near 1.2200 at the latest, restricts the quote’s immediate downside.
It’s worth noting, however, that the GBP/USD weakness past 1.2153 won’t hesitate to refresh the monthly low, currently around 1.1840.
GBP/USD: Four-hour chart
Trend: Further downside expected
Information on these pages contains forward-looking statements that involve risks and uncertainties. Markets and instruments profiled on this page are for informational purposes only and should not in any way come across as a recommendation to buy or sell in these assets. You should do your own thorough research before making any investment decisions. FXStreet does not in any way guarantee that this information is free from mistakes, errors, or material misstatements. It also does not guarantee that this information is of a timely nature. Investing in Open Markets involves a great deal of risk, including the loss of all or a portion of your investment, as well as emotional distress. All risks, losses and costs associated with investing, including total loss of principal, are your responsibility. The views and opinions expressed in this article are those of the authors and do not necessarily reflect the official policy or position of FXStreet nor its advertisers. The author will not be held responsible for information that is found at the end of links posted on this page.
If not otherwise explicitly mentioned in the body of the article, at the time of writing, the author has no position in any stock mentioned in this article and no business relationship with any company mentioned. The author has not received compensation for writing this article, other than from FXStreet.
FXStreet and the author do not provide personalized recommendations. The author makes no representations as to the accuracy, completeness, or suitability of this information. FXStreet and the author will not be liable for any errors, omissions or any losses, injuries or damages arising from this information and its display or use. Errors and omissions excepted.
The author and FXStreet are not registered investment advisors and nothing in this article is intended to be investment advice.
Recommended content
Editors’ Picks

AUD/USD holds lower ground below 0.6350 after dismal Australian data
AUD/USD keeps its offered tone intact below 0.6350 in Wednesday's Asian trading, undermined by below forecasts Australian Constuction Output and monthly CPI data. The data fan more RBA rate cut expectations. Risk-off flows and renewed US Dollar demand also add to the weight on the Aussie.

USD/JPY: Rebound gathers steam to near 149.50
USD/JPY is extending the rebound to near 149.50 in Asian trading on Wednesday. The pair tracks the upswing in the US Dollar and the US Treasury bond yields, fuelled by the US House passage of the Republican Budget plan, advancing Trump's tax plans.

Gold buyers jump back amid tariff uncertainty
Gold price struggles to build on Tuesday’s rebound in the Asian session on Wednesday. Gold buyers try their luck as safe-haven flows return on US President Donald Trump’s tariff uncertainty and weak US economic prospects.

Strategy stock dips as Bitcoin price crashes below $90K, sparking concerns of forced liquidation
Strategy witnessed an 11% stock decline on Tuesday, stirred by Bitcoin's market's plunge below $90,000 and fueling speculations of a forced liquidation for the company.

Five fundamentals for the week: Fallout from German vote, Fed's favorite figure stand out Premium
Statements, not facts, are set to dominate the last week of February. Further fallout from Germany's elections and new comments from Trump on trade may overshadow most figures –but not the Fed's favorite inflation figure.

The Best brokers to trade EUR/USD
SPONSORED Discover the top brokers for trading EUR/USD in 2025. Our list features brokers with competitive spreads, fast execution, and powerful platforms. Whether you're a beginner or an expert, find the right partner to navigate the dynamic Forex market.