|

GBP/USD Price Analysis: Pound tests the descending triangle breakout below 1.2100

  • Test of the descending triangle breakout will provide a buying opportunity at bargain prices.
  • Fed’s view of policy moderation has infused fresh blood into risk-sensitive currencies.
  • Oscillation in the bullish range of 60.00-80.00 by the RSI (14) adds to the upside filters.

The GBP/USD pair is displaying a lackluster performance after dropping from the round-level resistance of 1.2100 in the Asian session. Exhaustion in the upside momentum has faded Cable’s rally for a while, however, the upside bias is still intact amid the risk appetite theme.

Meanwhile, the US Dollar Index (DXY) is aiming to build a cushion around 105.50 as Federal Reserve (Fed) chair Jerome Powell has supported moderation of policy tightening to safeguard the United States economy from any crash.

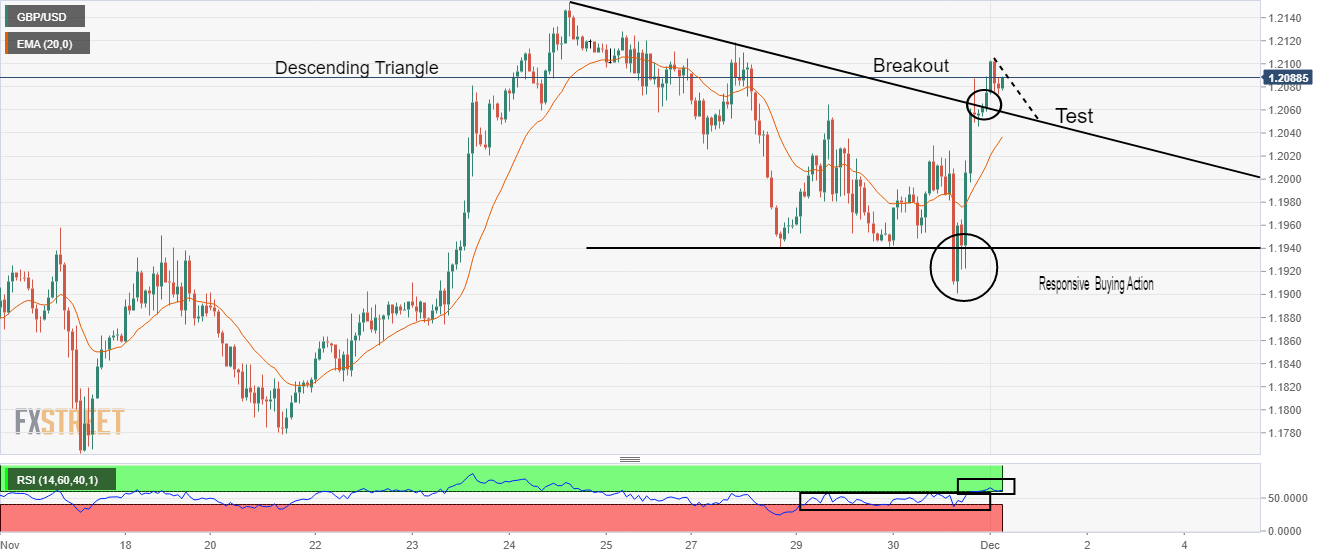
On an hourly scale, the Cable is expected to test the breakout of the descending triangle chart pattern near 1.2060. The downward-sloping trendline of the aforementioned chart pattern is placed from November 24 high at 1.2154 while the horizontal support is plotted from November 28 low at 1.1941.

It is worth noting that Cable witnessed a responsive buying action on Wednesday around 1.1900 that safeguarded the descending triangle breakdown. This has also strengthened the odds of an upside move ahead.

Advancing 20-period Exponential Moving Average (EMA) at 1.2030 adds to the upside filters. Also, the Relative Strength Index (RSI) (14) is oscillating in a bullish range of 60.00-80.00, which indicates a continuation of bullish momentum.

Going forward, a corrective move near the 1.2060 area will present a bargain buying opportunity for the market participants, which will drive the Cable towards Monday’s high at 1.2118, followed by November 24 high at 1.2154.

Alternatively, a decisive drop below Wednesday’s low at 1.1900 will drag the Cable toward November 22 low at 1.1825. A slippage below the latter will drag the pair to near November 21 low at 1.1779.

GBP/USD hourly chart

GBP/USD

Overview
Today last price1.2082
Today Daily Change0.0026
Today Daily Change %0.22
Today daily open1.2056
 
Trends
Daily SMA201.1786
Daily SMA501.1455
Daily SMA1001.1647
Daily SMA2001.2161
 
Levels
Previous Daily High1.2087
Previous Daily Low1.19
Previous Weekly High1.2154
Previous Weekly Low1.1779
Previous Monthly High1.2154
Previous Monthly Low1.1147
Daily Fibonacci 38.2%1.2016
Daily Fibonacci 61.8%1.1972
Daily Pivot Point S11.1942
Daily Pivot Point S21.1828
Daily Pivot Point S31.1755
Daily Pivot Point R11.2128
Daily Pivot Point R21.2201
Daily Pivot Point R31.2315

Author

Sagar Dua

Sagar Dua

FXStreet

Sagar Dua is associated with the financial markets from his college days. Along with pursuing post-graduation in Commerce in 2014, he started his markets training with chart analysis.

More from Sagar Dua
Share:

Editor's Picks

EUR/USD stays well offered below 1.1800

The selling pressure on EUR/USD is picking up pace, with the pair slipping decisively below the key 1.1800 level and sliding to fresh two week lows as Wednesday’s session draws to a close. The move lower comes as the US Dollar finds renewed strength after the latest round of US data and the release of the FOMC Minutes. Next of note on the docket will be the US weekly Initial Jobless Claims.
 

GBP/USD reaches multi-day lows near 1.3500

GBP/USD reverses its initial upside momentum and is now adding to previous declines, approaching the 1.3500 region on Wednesday. Cable’s downtick comes on the back of decent gains in the Greenback and easing UK inflation figures, which seem to have reinforced the case for a BoE rate cut in March.

Gold battle to regain $5,000 continues

Gold is back on the front foot on Wednesday, shaking off part of the early week softness and challenging two-day highs near the $5,000 mark per troy ounce. The move comes ahead of the FOMC Minutes and is unfolding despite an intense rebound in the US Dollar.

Bitcoin has found or is near a bottom, extended consolidation to follow: K33

Bitcoin (BTC) is nearing or has already established a bottom, which could be followed by a sustained period of slow price movement, according to K33.

Mixed UK inflation data no gamechanger for the Bank of England

Food inflation plunged in January, but service sector price pressure is proving stickier. We continue to expect Bank of England rate cuts in March and June. The latest UK inflation read is a mixed bag for the Bank of England, but we doubt it drastically changes the odds of a March rate cut.

Sui extends sideways action ahead of Grayscale’s GSUI ETF launch

Sui is extending its downtrend for the second consecutive day, trading at 0.95 at the time of writing on Wednesday. The Layer-1 token is down over 16% in February and approximately 34% from the start of the year, aligning with the overall bearish sentiment across the crypto market.