|

GBP/USD Price Analysis: Pound dropping sharply, nearing 1.3000 figure

  • The market is in search of a clear direction. 
  • The level to beat for sellers is the 1.2973 level.
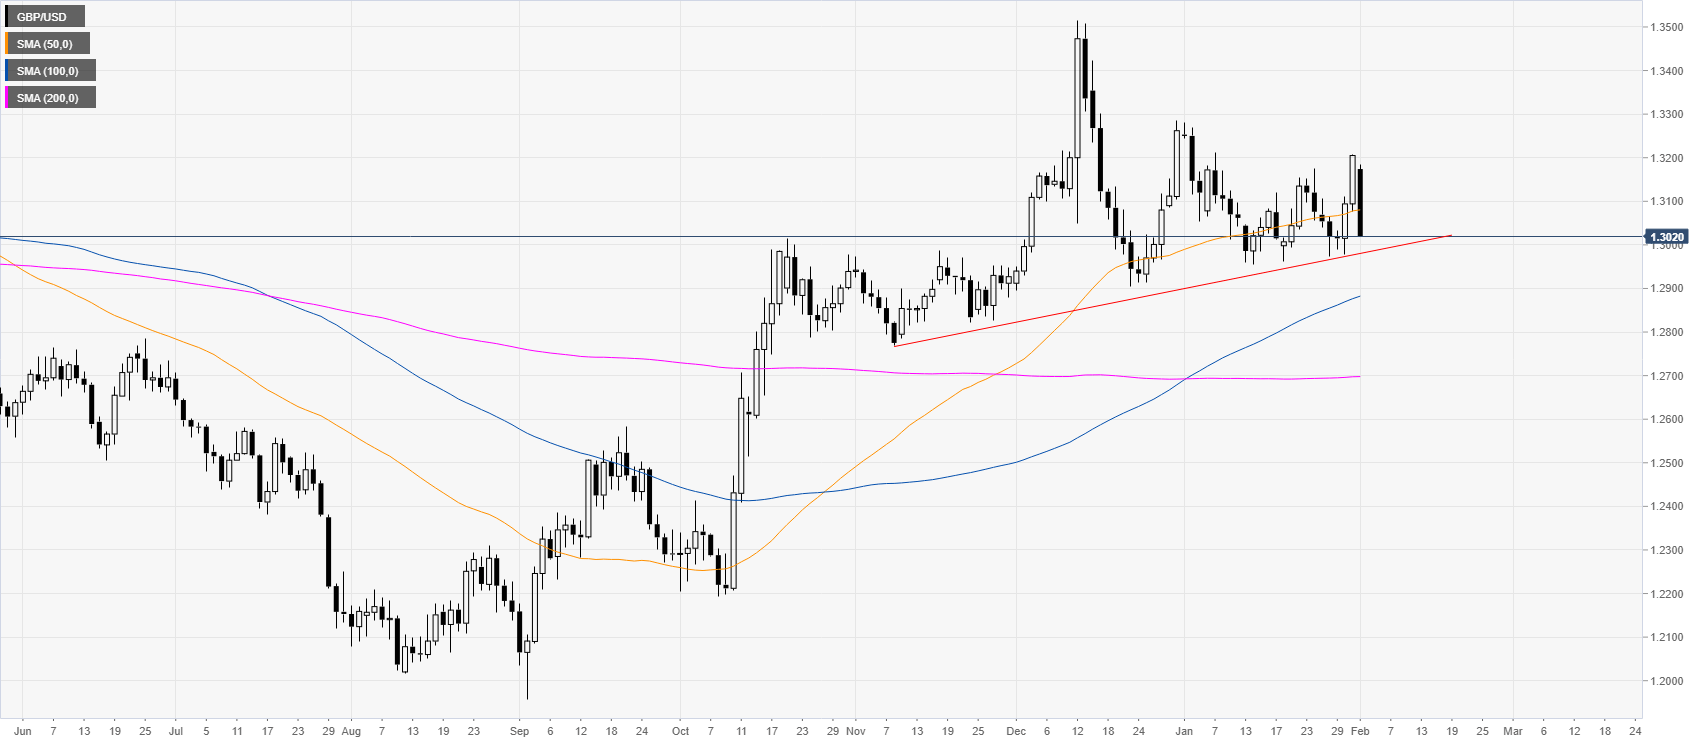
 

GBP/USD daily chart 


 The market is essentially ranging above the 100/200-day simple moving averages (SMAs) and an ascending trendline. 
 

GBP/USD four-hour chart

 
The pound is dropping sharply from the upper range of the last month of trading. Bears are likely back in control and a break below the 1.3010 support can lead to the 1.2967 and 1.2900 levels, according to the Technical Confluences Indicator. Resistances are seen near the 1.3035, 1.3080 and 1.3129 levels.   
 
 
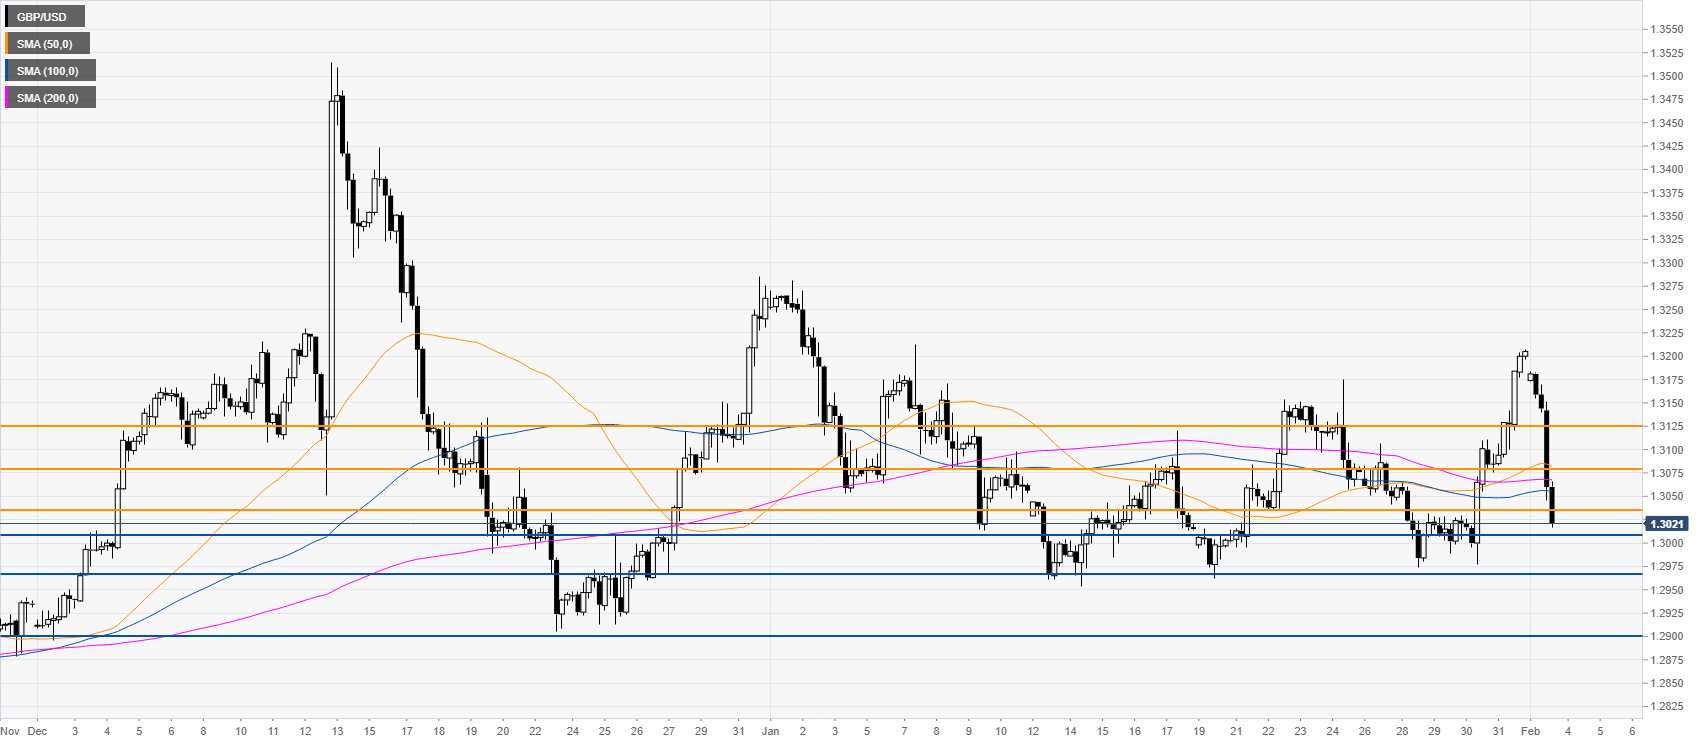
Resistance: 1.3035, 1.3080, 1.3129 
Support: 1.3010, 1.2967, 1.2900


Additional key levels

GBP/USD

Overview
Today last price1.3018
Today Daily Change-0.0187
Today Daily Change %-1.42
Today daily open1.3205
 
Trends
Daily SMA201.3071
Daily SMA501.3073
Daily SMA1001.2874
Daily SMA2001.2696
 
Levels
Previous Daily High1.3207
Previous Daily Low1.3076
Previous Weekly High1.3207
Previous Weekly Low1.2974
Previous Monthly High1.3281
Previous Monthly Low1.2954
Daily Fibonacci 38.2%1.3157
Daily Fibonacci 61.8%1.3126
Daily Pivot Point S11.3118
Daily Pivot Point S21.3032
Daily Pivot Point S31.2987
Daily Pivot Point R11.3249
Daily Pivot Point R21.3294
Daily Pivot Point R31.338

Author

Flavio Tosti

Flavio Tosti

Independent Analyst


More from Flavio Tosti
Share:

Editor's Picks

EUR/USD keeps the offered stance just above 1.1700

EUR/USD is coming under heavy selling pressure in what has been a rather grim start to the new trading week, with the pair now trading close to the 1.1700 support area as the US Dollar stages a solid rebound. The prevailing flight to safety mood continues to favour the Greenback, as investors react to the escalating conflict in the Middle East and trim risk exposure across the board.

GBP/USD hits new yearly lows near 1.3300

GBP/USD adds to the recent bearish tone, approaching to the key 1.3300 support to reach fresh YTD troughs against the backdrop of the robust performance of the US Dollar. Indeed, Cable’s decline comes amid the firm demand for the safe-haven space in the wake of the US and Israel attacks to Iran.

Gold trims losses, back below $5,400

Gold now surrenders part of the earlier advance past the $5,400 mark per troy ounce at the beginning of the week. Indeed, the precious metal’s strong uptick remains fuelled by increasing geopolitical tensions in the Middle East amid the intense demand for safer assets.

Bitcoin on brink of breakdown amid US-Iran war

Bitcoin (BTC) remains under pressure near the key support level of $65,700. Trading at $66,400 at the time of writing on Monday, a breakdown below this critical level would suggest a deeper correction ahead.

The Fed is finally talking about AI – Here's why it matters for the US Dollar

AI is moving from earnings calls into the heart of monetary policy discussions, forcing Federal Reserve officials to confront a new question: How to act if AI reshapes inflation, employment and interest rates at the same time?

Grass 20% bullish breakout defies broader market weakness

Grass (GRASS) is edging up above $0.30 at the time of writing on Monday. The token’s notable 20% intraday surge stands out amid heightened volatility in the broader crypto market.