|

GBP/USD Price Analysis: On the way to 1.3760 resistance

  • GBP/USD holds on to recovery moves above 1.3700.
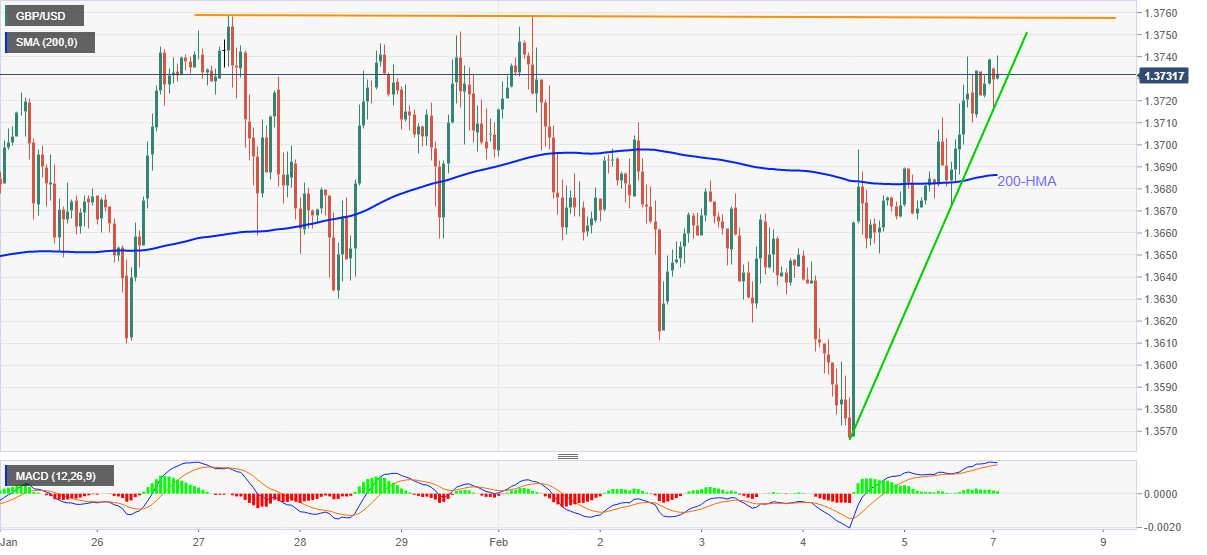
  • Sustained trading beyond 200-HMA, immediate rising support line and bullish MACD favor another attempt to break the key resistance line.

GBP/USD eases from intraday high of 1.3740 to 1.3730 during Monday’s Asian session. In doing so, the cable keeps its run-up beyond 200-HMA and an upward sloping trend line from Thursday amid bullish MACD.

As a result, the bulls are all trying to re-attack the horizontal hurdle around 1.3757-58, a break of which will eye for the March 2018 peak surrounding 1.3775 and the 1.3800 threshold.

It should, however, be noted that the GBP/USD buyers’ dominance past-1.3800 mark will eye for the early April 2018 low near 1.3965 before challenging the 1.4000 psychological magnet.

Alternatively, a downside break of the short-term support line, at 1.3720 now, should quickly drag the quote to a 200-HMA level of 1.3686.

In a case where the GBP/USD sellers keep the reins below 1.3686, the monthly low of 1.3566 will be in the spotlight.

GBP/USD hourly chart

Trend: Bullish

Additional important levels

Overview
Today last price1.3732
Today Daily Change-7 pips
Today Daily Change %-0.05%
Today daily open1.3739
 
Trends
Daily SMA201.3664
Daily SMA501.355
Daily SMA1001.3296
Daily SMA2001.3006
 
Levels
Previous Daily High1.374
Previous Daily Low1.3666
Previous Weekly High1.3758
Previous Weekly Low1.3566
Previous Monthly High1.3759
Previous Monthly Low1.3451
Daily Fibonacci 38.2%1.3712
Daily Fibonacci 61.8%1.3694
Daily Pivot Point S11.369
Daily Pivot Point S21.3641
Daily Pivot Point S31.3616
Daily Pivot Point R11.3764
Daily Pivot Point R21.3789
Daily Pivot Point R31.3838

Author

Anil Panchal

Anil Panchal

FXStreet

Anil Panchal has nearly 15 years of experience in tracking financial markets. With a keen interest in macroeconomics, Anil aptly tracks global news/updates and stays well-informed about the global financial moves and their implications.

More from Anil Panchal
Share:

Editor's Picks

EUR/USD seems fragile below 1.1700 as Middle East war boosts energy prices

The EUR/USD pair trades flat at around 1.1680 during the Asian trading session on Tuesday, but broadly seems vulnerable, being close to its five-week low. The major currency pair is under pressure as surging oil prices due to the United States-Israel war with Iran have increased the risks of higher inflation for the Old Continent.

GBP/USD hovers around 1.3400 with bearish pressure intact

GBP/USD edges higher after three days of losses, trading around 1.3400 during the Asian hours on Tuesday. The technical analysis of the daily chart indicates an ongoing bearish bias, as the pair trades within a descending channel pattern.

Gold sticks to gains above $5,350 amid sustained safe-haven demand; firmer USD caps gains

Gold sticks to its positive bias for the third straight day and trades above the $5,350 level heading into the European session on Tuesday. Concerns about a broader regional conflict in the Middle East continue to weigh on investors' sentiment and underpin demand for the traditional safe-haven bullion.

Stellar risks deeper losses as derivatives metrics turn negative

Stellar is trading red below $0.16 at the time of writing on Tuesday, after a slight recovery the previous day. Weakening derivatives data caps the recovery, while an unfavorable technical outlook projects a deeper correction for the XLM token in the upcoming days.

The market is not panicking it is repricing the probability distribution of Oil and time

At the end of the day, markets do not trade morality or geopolitics. They trade transmission channels. And the only channel that truly matters in this maelstrom runs through the price of energy and the time value of money.

Hyperliquid Price Forecast: HYPE rises on commodities demand amid US-Iran war

Hyperliquid (HYPE) steadies above $33 at press time on Tuesday, marking its fourth consecutive day of recovery in a broadly volatile market due to the ongoing US-Israel strikes on Iran.