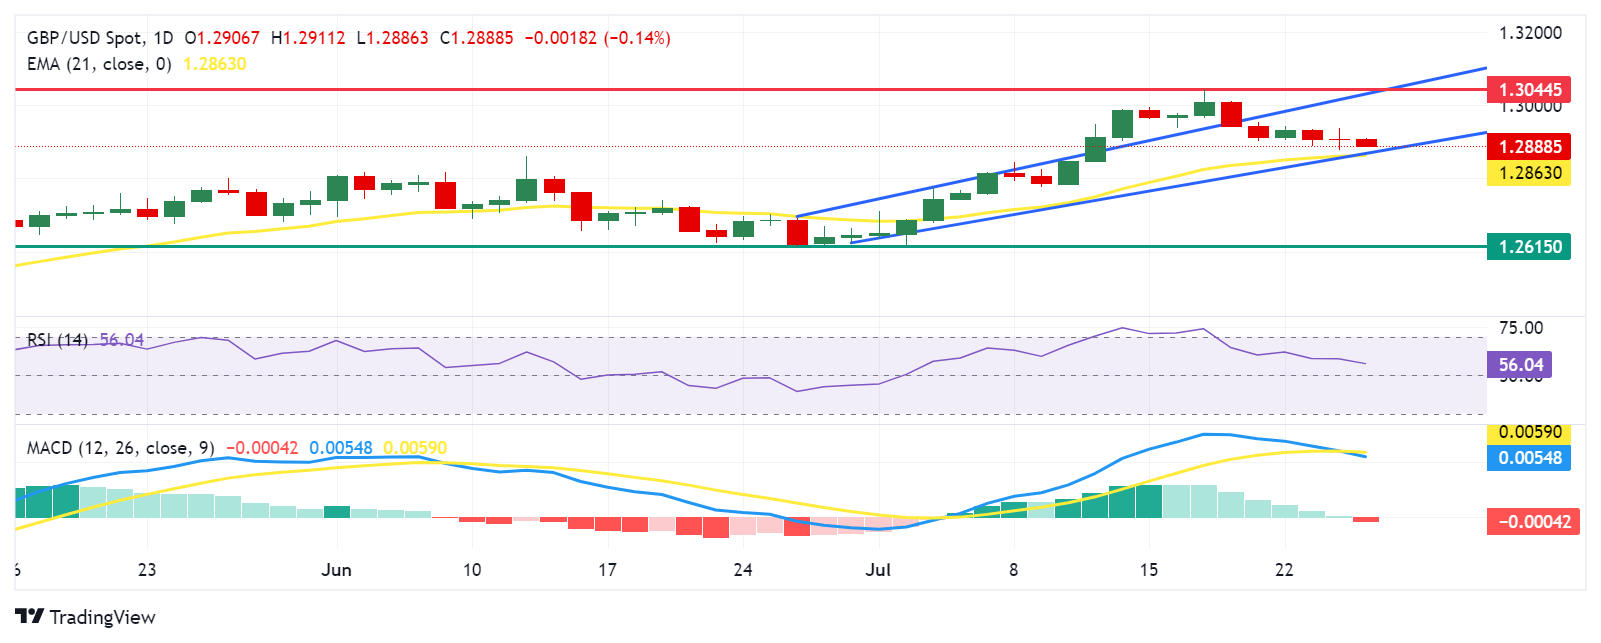
- GBP/USD could test the lower boundary of the ascending channel and the 21-day EMA at the 1.2863 level.
- The technical analysis suggests a momentum shift as the MACD line has crossed below the signal line.
- A break above the 1.2900 level could lead the pair to approach the upper edge of the ascending channel.
GBP/USD continues to lose ground for the third successive session, trading around 1.2890 during the Asian hours on Thursday. The analysis of the daily chart shows the pair consolidates within an ascending channel, signaling a bullish bias for the pair's price movements.
The Moving Average Convergence Divergence (MACD), a momentum indicator, shows a shift in momentum as the MACD line crosses below the signal line. Despite this, the MACD line remains above the centerline. Observing further movement will help clarify the directional trend. Additionally, the 14-day Relative Strength Index (RSI) sits above the 50 level, suggesting a confirmation of a bullish bias.
On the downside, immediate support seems to be around the lower edge of the ascending channel, coinciding with the 21-day Exponential Moving Average (EMA) at the 1.2863 level. A drop below this support could drive the GBP/USD pair toward the throwback support level of 1.2615.
Regarding resistance, the immediate barrier appears at the psychological level of 1.2900. A break above this level could lead the GBP/USD pair to approach the upper edge of the ascending channel near the key level of 1.3040, followed by the yearly peak of 1.3044 level reached on July 17.
GBP/USD: Daily Chart
British Pound PRICE Today
The table below shows the percentage change of British Pound (GBP) against listed major currencies today. British Pound was the weakest against the Japanese Yen.
| USD | EUR | GBP | JPY | CAD | AUD | NZD | CHF | |
|---|---|---|---|---|---|---|---|---|
| USD | 0.00% | 0.14% | -0.64% | 0.08% | 0.54% | 0.24% | -0.22% | |
| EUR | -0.00% | 0.14% | -0.66% | 0.08% | 0.54% | 0.23% | -0.22% | |
| GBP | -0.14% | -0.14% | -0.77% | -0.06% | 0.42% | 0.10% | -0.36% | |
| JPY | 0.64% | 0.66% | 0.77% | 0.73% | 1.20% | 0.87% | 0.44% | |
| CAD | -0.08% | -0.08% | 0.06% | -0.73% | 0.47% | 0.16% | -0.30% | |
| AUD | -0.54% | -0.54% | -0.42% | -1.20% | -0.47% | -0.29% | -0.77% | |
| NZD | -0.24% | -0.23% | -0.10% | -0.87% | -0.16% | 0.29% | -0.46% | |
| CHF | 0.22% | 0.22% | 0.36% | -0.44% | 0.30% | 0.77% | 0.46% |
The heat map shows percentage changes of major currencies against each other. The base currency is picked from the left column, while the quote currency is picked from the top row. For example, if you pick the British Pound from the left column and move along the horizontal line to the US Dollar, the percentage change displayed in the box will represent GBP (base)/USD (quote).
Information on these pages contains forward-looking statements that involve risks and uncertainties. Markets and instruments profiled on this page are for informational purposes only and should not in any way come across as a recommendation to buy or sell in these assets. You should do your own thorough research before making any investment decisions. FXStreet does not in any way guarantee that this information is free from mistakes, errors, or material misstatements. It also does not guarantee that this information is of a timely nature. Investing in Open Markets involves a great deal of risk, including the loss of all or a portion of your investment, as well as emotional distress. All risks, losses and costs associated with investing, including total loss of principal, are your responsibility. The views and opinions expressed in this article are those of the authors and do not necessarily reflect the official policy or position of FXStreet nor its advertisers. The author will not be held responsible for information that is found at the end of links posted on this page.
If not otherwise explicitly mentioned in the body of the article, at the time of writing, the author has no position in any stock mentioned in this article and no business relationship with any company mentioned. The author has not received compensation for writing this article, other than from FXStreet.
FXStreet and the author do not provide personalized recommendations. The author makes no representations as to the accuracy, completeness, or suitability of this information. FXStreet and the author will not be liable for any errors, omissions or any losses, injuries or damages arising from this information and its display or use. Errors and omissions excepted.
The author and FXStreet are not registered investment advisors and nothing in this article is intended to be investment advice.
Recommended content
Editors’ Picks
EUR/USD trims gains around 1.0840 post-US GDP

The Greenback regains some composure and motivates EUR/USD to give away part of its earlier advance on Thursday, returning to the 1.0840 region in the wake of the release of the advanced US GDP Growth Rate in the second quarter.
GBP/USD remains on the defensive below 1.2900 on US data

GBP/USD maintains the negative bias in the 1.2870 zone amidst a mild bounce in the US dollar following the publication of advanced Q2 GDP readings.
Gold keeps its offered stance near $2,370 following US GDP prints

Gold prices maintain their bearish performance around $2,370 after preliminary US GDP Growth Rate came in above estimates in Q2 and US yields trade with a negative bias.
Bitcoin price declines as Kraken exchange executes first reimbursements to Mt. Gox creditors

Bitcoin Magazine CEO David Bailey confirms that Kamala Harris will not speak at the upcoming Bitcoin Conference. Bitcoin adoption has grown as Ferrari Luxury Car Manufacturer accepts crypto payments across Europe.
Inflation tracker – July 2024, contrasting trends

In the United States, consumer price inflation is slowing, in line with the cooling of the labour market. After three months of more restrained growth, the CPI index fell in June, month-on-month, for the first time in two years.