|

GBP/USD Price Analysis: Manages to hold above 200-hour SMA, 1.2800 mark

  • GBP/USD witnessed some selling on Wednesday, albeit lacked any strong follow-through.
  • Mixed technical indicators on hourly/daily charts warrant some caution for bearish traders.

The GBP/USD pair maintained its offered tone through the early North American session, albeit has still managed to hold its neck above the 200-hour SMA.

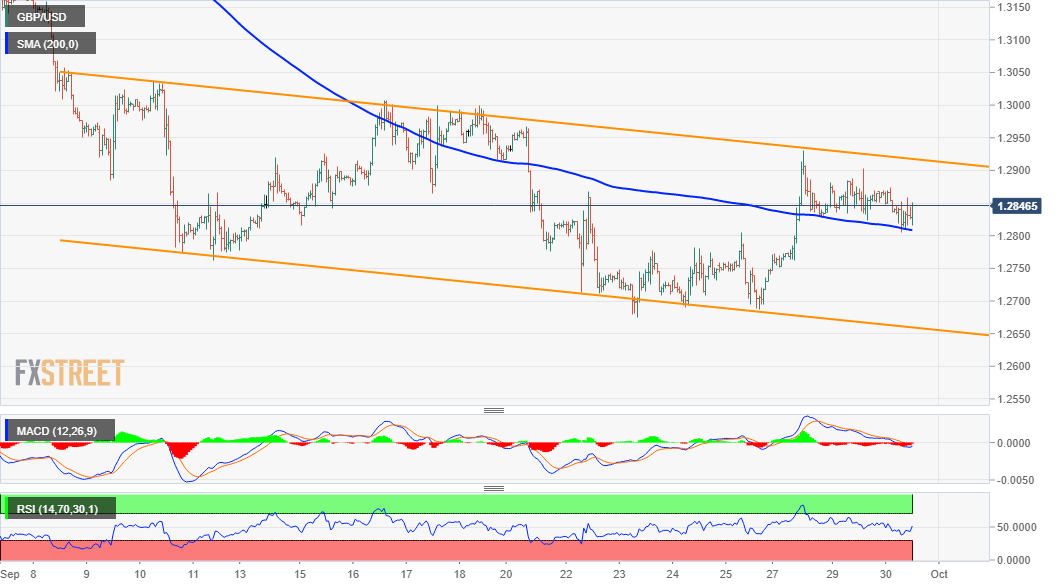
Meanwhile, this week's goodish recovery move from the very important 200-day SMA stalled near a resistance marked by the top end of a three-week-old descending trend-channel. However, the lack of any strong follow-through selling warrants some caution for aggressive bearish traders.

Technical indicators on the daily chart maintained their negative bias, albeit are yet to confirm the bearish outlook on hourly charts. Hence, it will be prudent to wait for a sustained break below the 1.2800 mark (200-hour SMA) before positioning for the resumption of the recent bearish trend.

The GBP/USD pair migh then turn vulnerable and accelerate the fall further towards testing the 1.2735-30 intermediate support. The downward momentum has the potential to drag the pair back towards the 1.2700 mark en-route multi-weekly lows support near the 1.2675 region.

On the flip side, the 1.2900 mark now seems to have emerged as immediate strong support and is closely followed by the top end of the trend-channel, around the 1.2925-30 region. A convincing breakthrough will set the stage for a move towards conquering the key 1.3000 psychological mark.

GBP/USD 1-hourly chart

fxsoriginal

Technical levels to watch

GBP/USD

Overview
Today last price1.283
Today Daily Change-0.0035
Today Daily Change %-0.27
Today daily open1.2865
 
Trends
Daily SMA201.2936
Daily SMA501.3024
Daily SMA1001.2744
Daily SMA2001.272
 
Levels
Previous Daily High1.2903
Previous Daily Low1.2823
Previous Weekly High1.2967
Previous Weekly Low1.2676
Previous Monthly High1.3396
Previous Monthly Low1.2982
Daily Fibonacci 38.2%1.2872
Daily Fibonacci 61.8%1.2853
Daily Pivot Point S11.2824
Daily Pivot Point S21.2783
Daily Pivot Point S31.2744
Daily Pivot Point R11.2905
Daily Pivot Point R21.2944
Daily Pivot Point R31.2985

Author

Haresh Menghani

Haresh Menghani is a detail-oriented professional with 10+ years of extensive experience in analysing the global financial markets.

More from Haresh Menghani
Share:

Editor's Picks

EUR/USD looks to regain the 200-day SMA

EUR/USD regains some balance and trade just above 1.1600 the figure ahead of the opening bell in Asia. The pair initially dipped to the 1.1530 zone for the first time since November, always following the stronger US Dollar and the marked flight-to-safety in the context of the ongoing Middle East crisis
 

GBP/USD attacks 1.3300, refreshing three-month lows

GBP/USD is deep in the red near 1.3300, accelerating its downside to renew three-month lows in European trading on Tuesday. The ongoing escalation in the Iran war, combined with rising Oil prices, weighs negatively on the higher-yielding Pound Sterling as the US Dollar capitalizes on increased haven demand.

Gold bounces off lows, back above $5,100

Gold remains on the defensive, eroding part of the recent multi-day advance and managing to trade back above the $5,100 mark per troy ounce on Tuesday. The precious metal initially dropped just below the critical $5,000 threshold on the back of the persistent strength of the Greenback, higher US Treasury yields across the curve and investors' repricing of Fed rate cuts.

XRP risks extending losses as US-Iran war rages on

Ripple (XRP) has come under pressure, drifting lower to $1.35 at the time of writing on Tuesday. The over 2% correction looks poised to erase the previous day’s gains, which lifted the remittance token to $1.42.

Energy shock 2.0: Why rising Gas prices could hit the Euro

Even without a confirmed, sustained disruption, the mere risk to a key global energy chokepoint is enough to inject a significant premium into European Gas markets. And for the Euro, that matters.

Ripple falters amid sell-off jitters and negative funding rates

Ripple (XRP) has come under pressure, drifting lower to $1.35 at the time of writing on Tuesday. The over 2% correction looks poised to erase the previous day’s gains, which lifted the remittance token to $1.42.