GBP/USD Price Analysis: Licks wounds near 11-week low with limited upside potential
- GBP/USD snaps two-day downtrend, picks up bids from multi-day low.
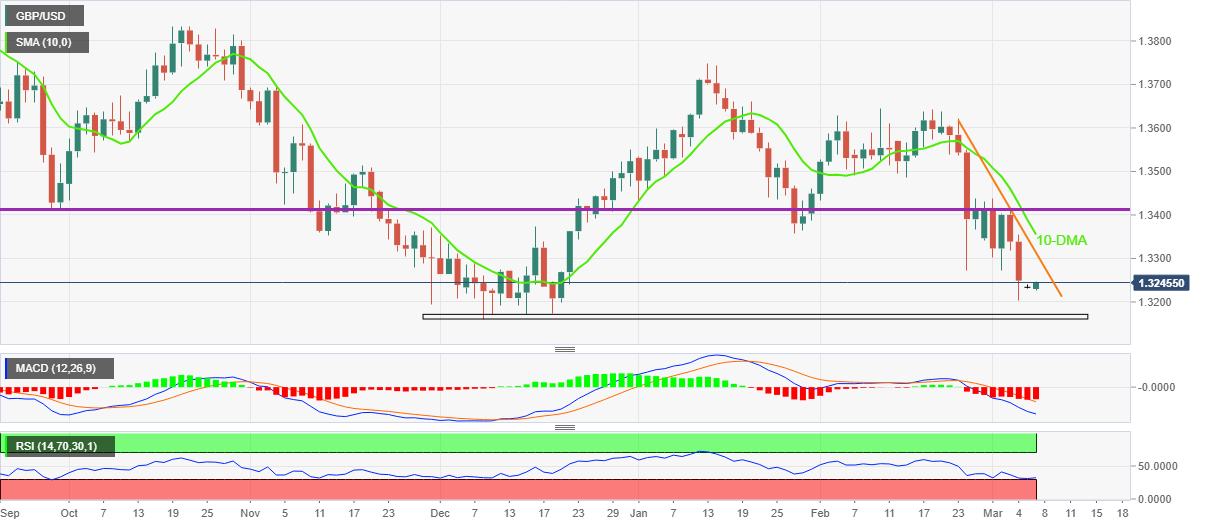
- Oversold RSI triggered corrective pullback but nearby resistance line, 10-DMA limits recovery moves.
- Multiple levels marked during late 2021 offer strong support to challenge bears.
- Bulls remain unconvinced below the 1.3415 horizontal resistance area.

GBP/USD consolidates the biggest weekly loss since November around 1.3235-40 during Monday’s Asian session.
The pair dropped to the lowest levels in 11 weeks by the end of Friday but oversold RSI triggered the cable pair’s corrective pullback.
However, a downward sloping trend line from February 23 and the 10-DMA, respectively around 1.3315 and 1.3355, test the rebound.
Even if the quote rises past 1.3355, a horizontal area comprising multiple levels since September 2021, around 1.3515, will be a tough nut to crack for the GBP/USD buyers.
Alternatively, the fresh downside will aim for the 1.3200 threshold before hitting a block near the 1.3160-70 zone that includes late 2021 levels.
In a case where GBP/USD drops below 1.3160, the 1.3100 round figure holds the key to the pair’s slump towards the 1.3000 psychological magnet.
Overall, GBP/USD is likely to consolidate some more losses before activating the further downside.
GBP/USD: Daily chart
Trend: Limited recovery expected
Author

Anil Panchal
FXStreet
Anil Panchal has nearly 15 years of experience in tracking financial markets. With a keen interest in macroeconomics, Anil aptly tracks global news/updates and stays well-informed about the global financial moves and their implications.


