- GBP/USD struggles to register any meaningful recovery and hangs near a one-month trough.
- Bets for an early rate cut by the BoE undermine the GBP and act as a headwind for the major.
- September Fed rate cut bets cap the upside for the USD and help limit losses for spot prices.
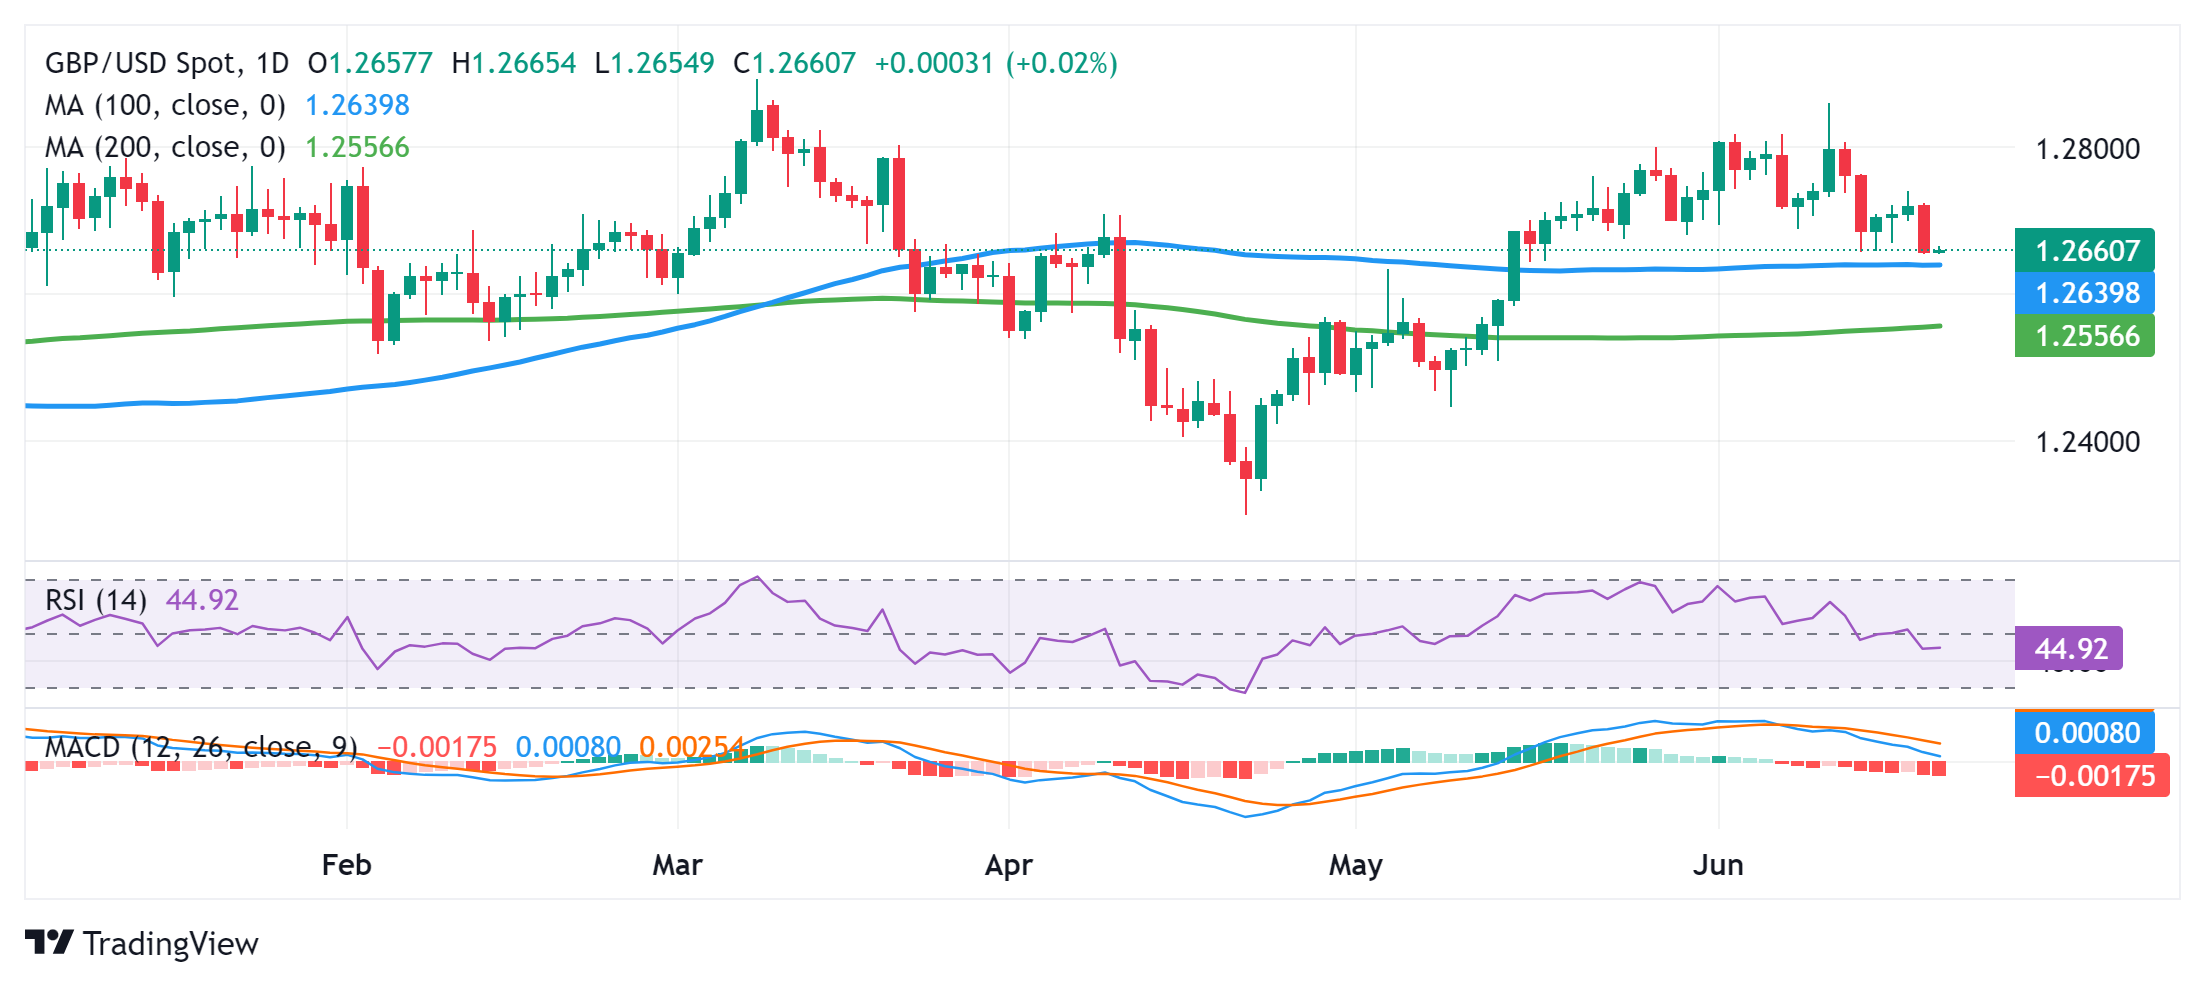
- A break below 100-day SMA is needed to support prospects for a further depreciating move.
The GBP/USD pair is seen oscillating in a range during the Asian session on Friday and consolidating the previous day's post-Bank of England (BoE) decline to over a one-month low. Spot prices currently trade just above mid-1.2600s and seem vulnerable to prolonging the recent retracement slide from a multi-month peak, around the 1.2860 region touched last week.
The markets started pricing in a greater chance of a rate cut in August after the BoE Governor Andrew Bailey said on Thursday that it was "good news" that official figures had shown inflation was back at its 2% target. This might continue to undermine the British Pound (GBP) ahead of the UK election on July 4 and validate the negative outlook for the GBP/USD pair. The US Dollar (USD), on the other hand, struggles to capitalize on the previous day's strong move up amid expectations for an imminent start of the Federal Reserve's (Fed) rate-cutting cycle in September. This, in turn, is seen lending some support to the currency pair.
From a technical perspective, bearish traders need to wait for some follow-through selling below the 100-day Simple Moving Average (SMA) support, currently pegged near the 1.2640-1.2635 region, before placing fresh bets. Given that oscillators on the daily chart have just started gaining negative traction, the GBP/USD pair might then accelerate the fall towards the 1.2600 mark. The downward trajectory could extend further towards challenging the very important 200-day SMA, around the 1.2560-1.2555 region en route to the 1.2500 psychological mark and the May monthly swing low, around the 1.2445 area.
On the flip side, any attempted recovery might now confront immediate resistance near the 1.2685 region ahead of the 1.2700 mark and the 1.2715-1.2720 supply zone. This is closely followed by the weekly top, around the 1.2740 area, which if cleared could trigger a short-covering rally and lift the GBP/USD pair to the 1.2800 round figure. The subsequent strength should pave the way for a move towards retesting the monthly swing high, around the 1.2860 zone, en route to the YTD peak, around the 1.2900 neighborhood touched in March.
GBP/USD daily chart
Information on these pages contains forward-looking statements that involve risks and uncertainties. Markets and instruments profiled on this page are for informational purposes only and should not in any way come across as a recommendation to buy or sell in these assets. You should do your own thorough research before making any investment decisions. FXStreet does not in any way guarantee that this information is free from mistakes, errors, or material misstatements. It also does not guarantee that this information is of a timely nature. Investing in Open Markets involves a great deal of risk, including the loss of all or a portion of your investment, as well as emotional distress. All risks, losses and costs associated with investing, including total loss of principal, are your responsibility. The views and opinions expressed in this article are those of the authors and do not necessarily reflect the official policy or position of FXStreet nor its advertisers. The author will not be held responsible for information that is found at the end of links posted on this page.
If not otherwise explicitly mentioned in the body of the article, at the time of writing, the author has no position in any stock mentioned in this article and no business relationship with any company mentioned. The author has not received compensation for writing this article, other than from FXStreet.
FXStreet and the author do not provide personalized recommendations. The author makes no representations as to the accuracy, completeness, or suitability of this information. FXStreet and the author will not be liable for any errors, omissions or any losses, injuries or damages arising from this information and its display or use. Errors and omissions excepted.
The author and FXStreet are not registered investment advisors and nothing in this article is intended to be investment advice.


Recommended content
Editors’ Picks

AUD/USD climbs above 0.6200 amid broad USD weakness and trade jitters
The Australian Dollar extended its advance on Thursday, climbing toward the 0.6240 zone. The pair built on recent strength as the US Dollar Index slid further toward multi-month lows near the 101 area. This move came after markets digested the White House’s confirmation of a steep 145% tariff on Chinese goods, combined with a cautious Federal Reserve tone.

EUR/USD surges higher as tariff walk-back eases tensions further
EUR/USD roared into its highest bids in nearly two years on Thursday, breaching and closing above the 1.1200 handle for the first time in 21 months. Market tensions continue to ease following the Trump administration’s last-minute pivot away from its own tariffs, sparking a softening in US Dollar flows.

Gold rises to record high near $3,200 on US-China tariff war
Gold price surges to near an all-time high around $3,190 during the early Asian session on Friday. The weakening of the US Dollar and escalating trade war between the United States and China provide some support to the precious metal.

Bitcoin miners scurry to import mining equipment following Trump's China tariffs
Bitcoin miners are reportedly scrambling to import mining equipment into the United States following rising tariff tensions in the US-China trade war, according to a Blockspace report on Wednesday.

Trump’s tariff pause sparks rally – What comes next?
Markets staged a dramatic reversal Wednesday, led by a 12% surge in the Nasdaq and strong gains across major indices, following President Trump’s unexpected decision to pause tariff escalation for non-retaliating trade partners.

The Best brokers to trade EUR/USD
SPONSORED Discover the top brokers for trading EUR/USD in 2025. Our list features brokers with competitive spreads, fast execution, and powerful platforms. Whether you're a beginner or an expert, find the right partner to navigate the dynamic Forex market.