GBP/USD Price Analysis: Holds ground near 1.2850; next barrier at the upper boundary
- GBP/USD could test the upper boundary at the 1.2850 level, followed by the nine-day EMA at the 1.2869 level.
- The technical analysis suggests a consolidation phase or a potential reversal for the pair.
- A break below the descending channel could lead the pair navigating the region to the throwback support level of 1.2615.

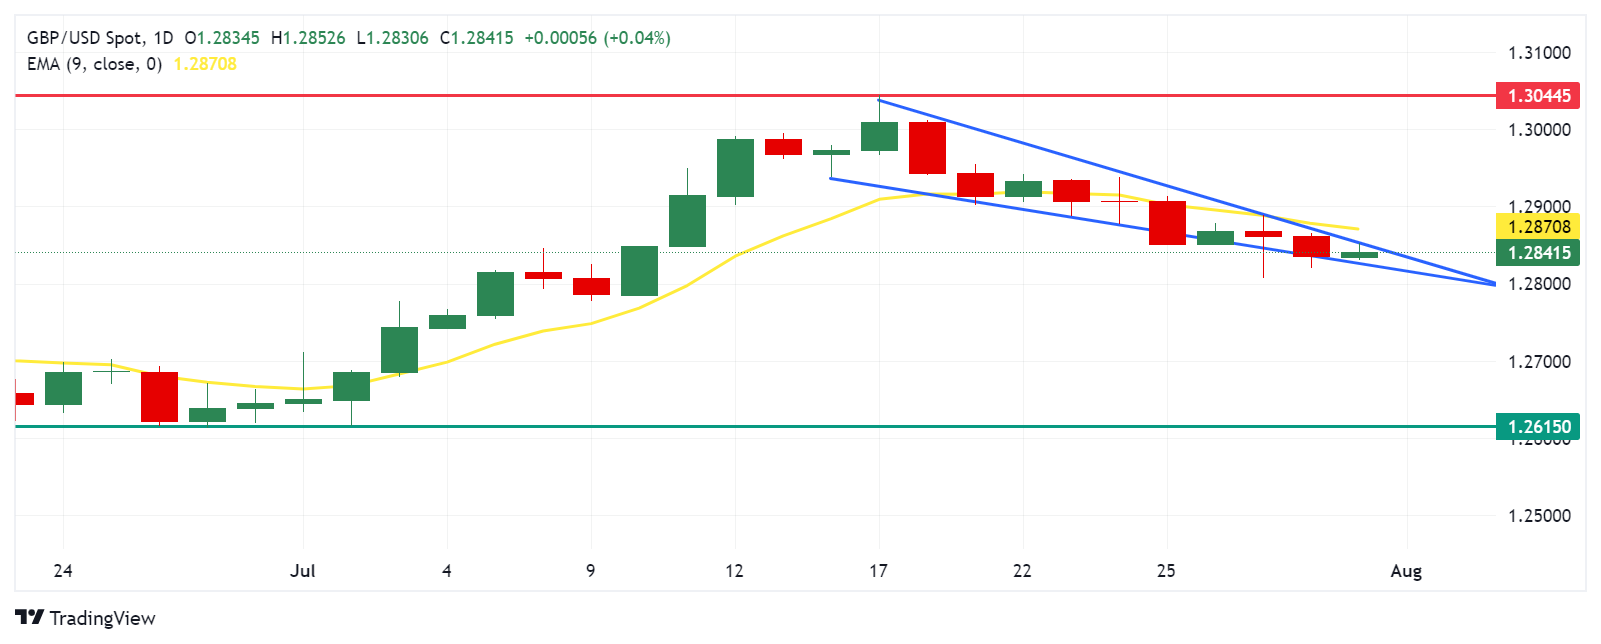
GBP/USD retraces its recent losses, trading around 1.2840 during the Asian hours on Wednesday. The analysis of the daily chart indicates that the pair is positioned in the narrow section of a descending channel, suggesting a consolidation phase or a potential reversal.
The Moving Average Convergence Divergence (MACD), a momentum indicator, shows a weakening of bullish momentum as the MACD line is below the signal line but above the centreline. Additionally, the 14-day Relative Strength Index (RSI) sits slightly below the 50 level, suggesting a bearish bias.
Regarding resistance, the immediate barrier appears around the upper boundary at the 1.2850 level, followed by the nine-day Exponential Moving Average (EMA) at the 1.2869 level. A breakout above this level could lead the GBP/USD pair to explore the area around the yearly peak of 1.3044 level reached on July 17.
On the downside, immediate support seems to be around the lower edge of the descending channel at the 1.2825 level. A break below this level could exert downward pressure on the GBP/USD pair to navigate the region around the throwback support level of 1.2615.
GBP/USD: Daily Chart
(This story was corrected on July 31 at 08:30 GMT to say, in the last paragraph, that "lower edge of the descending channel at the 1.2825 level," not at 1.2525)
British Pound PRICE Today
The table below shows the percentage change of British Pound (GBP) against listed major currencies today. British Pound was the strongest against the Australian Dollar.
| USD | EUR | GBP | JPY | CAD | AUD | NZD | CHF | |
|---|---|---|---|---|---|---|---|---|
| USD | -0.09% | -0.07% | 0.12% | -0.05% | 0.72% | 0.00% | -0.04% | |
| EUR | 0.09% | 0.04% | 0.23% | 0.03% | 0.80% | 0.11% | 0.07% | |
| GBP | 0.07% | -0.04% | 0.18% | -0.01% | 0.75% | 0.07% | 0.02% | |
| JPY | -0.12% | -0.23% | -0.18% | -0.12% | 0.59% | -0.13% | -0.13% | |
| CAD | 0.05% | -0.03% | 0.00% | 0.12% | 0.74% | 0.05% | 0.00% | |
| AUD | -0.72% | -0.80% | -0.75% | -0.59% | -0.74% | -0.70% | -0.75% | |
| NZD | 0.00% | -0.11% | -0.07% | 0.13% | -0.05% | 0.70% | -0.05% | |
| CHF | 0.04% | -0.07% | -0.02% | 0.13% | -0.00% | 0.75% | 0.05% |
The heat map shows percentage changes of major currencies against each other. The base currency is picked from the left column, while the quote currency is picked from the top row. For example, if you pick the British Pound from the left column and move along the horizontal line to the US Dollar, the percentage change displayed in the box will represent GBP (base)/USD (quote).
Author

Akhtar Faruqui
FXStreet
Akhtar Faruqui is a Forex Analyst based in New Delhi, India. With a keen eye for market trends and a passion for dissecting complex financial dynamics, he is dedicated to delivering accurate and insightful Forex news and analysis.


