|

GBP/USD Price Analysis: Flat-lines around 1.2500, near a three-month low

  • GBP/USD remains flat around 1.2500, near a three-month low hit on Wednesday.
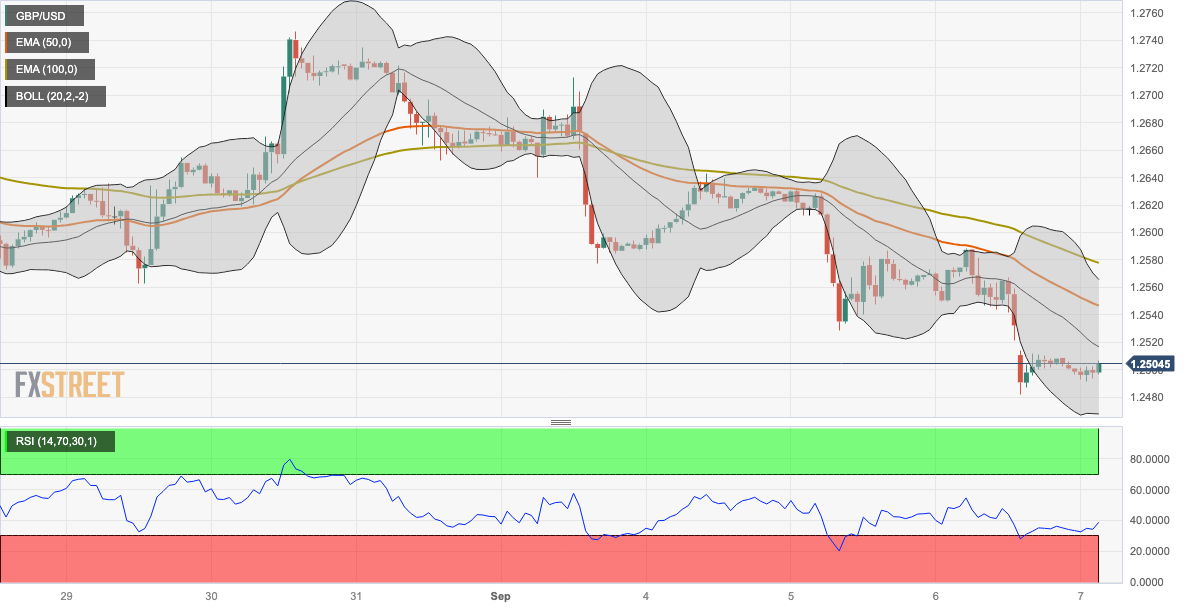
  • The pair holds below the 50- and 100-hour EMAs on a one-hour chart.
  • The first support level is located at 1.2465; immediate resistance level is seen at 1.2515.

The GBP/USD pair consolidates its recent losses around 1.2500 during the Asian session on Thursday. Meanwhile, the US Dollar Index (DXY), a measure of the value of USD against six other major currencies, hovers around 104.80 after retreating from the highest level since March. The strength of the Greenback is bolstered by the upbeat US ISM Services PMI, which came in better than expected and improved to a six-month high level of 54.5 in August.

On the other hand, the Pound Sterling (GBP) was weakened by Bank of England (BoE) Governor Andrew Bailey's dovish remark on Wednesday. He stated that BoE is much closer to ending its hiking cycle.

From the technical perspective, GBP/USD holds below the 50- and 100-hour Exponential Moving Averages (EMAs) with a downward slope on the one-hour chart, which means further downside looks favorable. Meanwhile, the Relative Strength Index (RSI) stands below 50, within bearish territory, suggesting that sellers are likely to retain control in the near term.

Any extended weakness below the lower limit of the Bollinger Band at 1.2465 will challenge the next contention at 1.2440 (a low of May 12) en route to 1.2390 (a low of June 6) and finally at 1.2350 (a low of May 31).

On the upside, the middle line of the Bollinger Band at 1.2515 acts as an immediate resistance level for GBP/USD. The additional upside filter is located at 1.2545 (50-hour EMA). Further north, the 1.2565-2575 zone appears a tough nut to crack for the Pound Sterling bears. The mentioned level represents the upper boundary of the Bollinger Band and the 100-hour EMA. The next barrier is seen near a psychological round mark at 1.2600.
 

GBP/USD one-hour chart

GBP/USD

Overview
Today last price1.2505
Today Daily Change-0.0003
Today Daily Change %-0.02
Today daily open1.2508
 
Trends
Daily SMA201.2665
Daily SMA501.2769
Daily SMA1001.2654
Daily SMA2001.2424
 
Levels
Previous Daily High1.2588
Previous Daily Low1.2482
Previous Weekly High1.2746
Previous Weekly Low1.2563
Previous Monthly High1.2841
Previous Monthly Low1.2548
Daily Fibonacci 38.2%1.2523
Daily Fibonacci 61.8%1.2548
Daily Pivot Point S11.2464
Daily Pivot Point S21.242
Daily Pivot Point S31.2358
Daily Pivot Point R11.257
Daily Pivot Point R21.2632
Daily Pivot Point R31.2676

Author

Lallalit Srijandorn

Lallalit Srijandorn is a Parisian at heart. She has lived in France since 2019 and now becomes a digital entrepreneur based in Paris and Bangkok.

More from Lallalit Srijandorn
Share:

Editor's Picks

EUR/USD sticks to positive bias above 1.1800 as trade jitters undermine USD

The EUR/USD pair builds on the previous day's modest gains and attracts some buyers for the second straight day on Thursday amid a softer US Dollar. Spot prices, however, lack bullish conviction and trade around the 1.1815-1.1820 area during the Asian session, up 0.10% for the day.

GBP/USD extends recovery to near 20-day EMA as US Dollar weakens

The Pound Sterling holds onto weekly gains around 1.3565 against the US Dollar during the Asian trading session on Thursday. The GBP/USD pair trades firmly as the US Dollar remains under pressure due to uncertainty surrounding the United States trade policy outlook.

Gold struggle with $5,200 extends ahead of more US-Iran talks

Gold is replicating the recovery moves seen in Wednesday’s Asian trading early Thursday, as buyers continue to flirt with the $5,200 level. Sustained US Dollar weakness and looming US-Iran talks aid the bright metal’s rebound.  

Top Crypto Gainers: Polkadot, Near Protocol, Uniswap lead market rebound

Altcoins, such as Polkadot, Near Protocol, and Uniswap, are leading gains over the last 24 hours as Bitcoin jumped 6% on Wednesday. The altcoins are holding steady at press time on Thursday following a rebound the previous day, testing the waters around their 50-day Exponential Moving Average. 

Nvidia delivers another monster earnings report, and forecasts big things to come

It was another monster earnings report from Nvidia for fiscal Q4. Revenues were $68.1bn, smashing estimates of $65bn. Gross profit margin was a healthy 75%, up from 73.5% in the prior quarter, and the outlook for this quarter was monstrous.

Cosmos Hub Price Forecast: ATOM rebounds slightly, bearish outlook remains intact

Cosmos Hub (ATOM) price rebounds, trading above $2.05 at the time of writing on Wednesday, after undergoing a sharp correction since last week. Weakening on-chain and derivatives data support a bearish outlook, while technical analysis remains unfavorable.