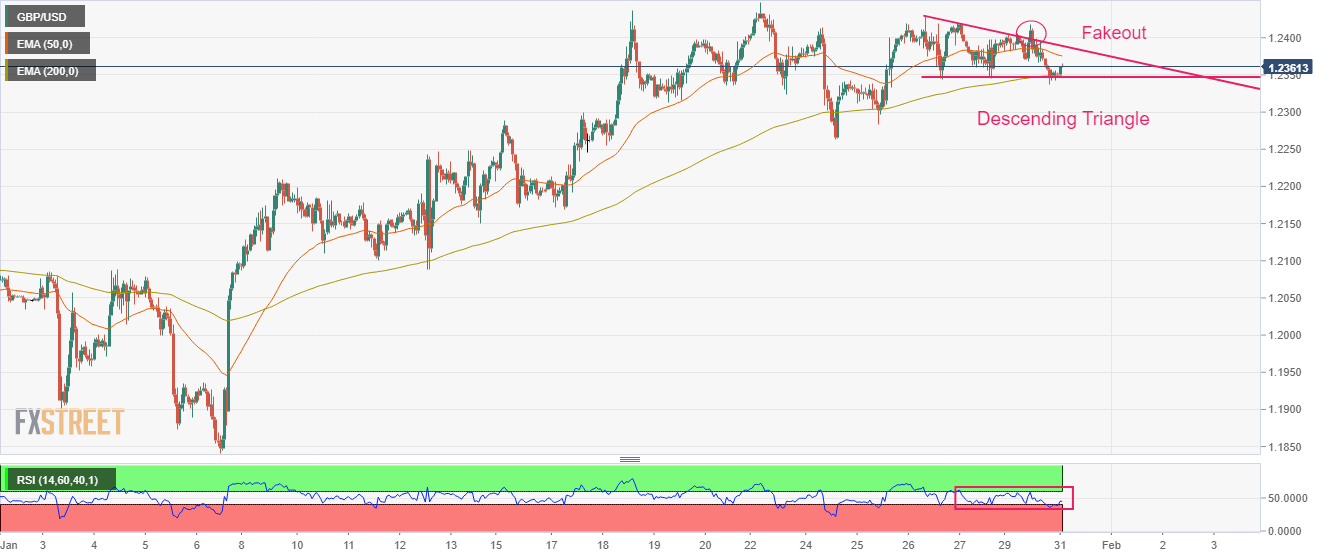
- The Cable has found a cushion as the USD Index has extended its correction.
- Pound Sterling bulls have found support from the 200-EMA around 1.2350.
- A breakdown of the RSI (14) into the 20.00-40.00 range will trigger the bearish momentum.
The GBP/USD pair has sensed a buying interest after dropping below 1.2340 in the Asian session. On Monday, the Cable witnessed selling pressure after failing to sustain above the round-level resistance of 1.2400. The major has shown a rebound amid a correction in the US Dollar Index (DXY) below 101.80, however, the downside bias for Cable is still solid amid overall pessimism in the market.
S&P500 futures have surrendered half of their gains recorded in early Asia, which indicates that the risk appetite of the market participants is declining again. Meanwhile, the 10-year year US Treasury yields are still holding above 3.54% despite a minor correction.
GBP/USD has picked significant bids after dropping to near the horizontal support of the Descending Triangle chart pattern plotted from January 26 low at 1.2344 on an hourly scale. The downward-sloping trendline of the aforementioned chart pattern is placed from January 26 high at 1.2430. On Monday, the Cable attempted to deliver a breakout of Descending Triangle, however, the lack of follow-up buying failed to maintain momentum in the Pound Sterling.
The asset is oscillating below the 50-period Exponential Moving Average (EMA) at 1.2375, which indicates that the short-term trend is bearish now.
On the contrary, the 200-EMA at 1.2350 has acted as a cushion for the Pound Sterling bulls.
The Relative Strength Index (RSI) (14) has yet not surrendered the 40.00-60.00 range. A breakdown into the 20.00-40.00 range will trigger the downside momentum.
Should the Cable break above the seven-month high of 1.2448 decisively, Pound Sterling bulls will drive the asset towards the psychological resistance of 1.2500 and June 7 high around 1.2600.
The Cable will display a sheer downside if it drops below Monday’s low at 1.2171 as it will drag the major toward January 11 low at 1.2100 followed by the psychological support at 1.2000.
GBP/USD hourly chart
Information on these pages contains forward-looking statements that involve risks and uncertainties. Markets and instruments profiled on this page are for informational purposes only and should not in any way come across as a recommendation to buy or sell in these assets. You should do your own thorough research before making any investment decisions. FXStreet does not in any way guarantee that this information is free from mistakes, errors, or material misstatements. It also does not guarantee that this information is of a timely nature. Investing in Open Markets involves a great deal of risk, including the loss of all or a portion of your investment, as well as emotional distress. All risks, losses and costs associated with investing, including total loss of principal, are your responsibility. The views and opinions expressed in this article are those of the authors and do not necessarily reflect the official policy or position of FXStreet nor its advertisers. The author will not be held responsible for information that is found at the end of links posted on this page.
If not otherwise explicitly mentioned in the body of the article, at the time of writing, the author has no position in any stock mentioned in this article and no business relationship with any company mentioned. The author has not received compensation for writing this article, other than from FXStreet.
FXStreet and the author do not provide personalized recommendations. The author makes no representations as to the accuracy, completeness, or suitability of this information. FXStreet and the author will not be liable for any errors, omissions or any losses, injuries or damages arising from this information and its display or use. Errors and omissions excepted.
The author and FXStreet are not registered investment advisors and nothing in this article is intended to be investment advice.
Recommended content
Editors’ Picks
EUR/USD holds lower ground below 1.0300 as traders await US NFP
EUR/USD holds lower ground below 1.0300 in European trading hours on Friday. Concerns over US President-elect Trump's policies and hawkish Fed expectations favor the US Dollar ahead of the critical US Nonfarm Payrolls data release.
GBP/USD falls back below 1.2300, US NFP eyed
GBP/USD is falling back below 1.2300 in the European morning on Friday, failing to sustain the rebound. The pair remains vulnerable amid persistent US Dollat strength and the UK bond market turmoil. The focus now shifts to the US labor market data for fresh trading directives.
Gold price sticks to intraday gains near multi-week top; US NFP in focus
Gold price attracts buyers for the fourth straight day on Friday amid some haven flows. The Fed’s hawkish stance, elevated US bond yields and a bullish USD should cap gains. Traders might also opt to wait for the release of the key US NFP report later this Friday.
Nonfarm Payrolls forecast: US December job gains set to decline sharply from November
US Nonfarm Payrolls are expected to rise by 160K in December after jumping by 227K in November. US jobs data is set to rock the US Dollar after hawkish Fed Minutes published on Wednesday.
How to trade NFP, one of the most volatile events Premium
NFP is the acronym for Nonfarm Payrolls, arguably the most important economic data release in the world. The indicator, which provides a comprehensive snapshot of the health of the US labor market, is typically published on the first Friday of each month.
Best Forex Brokers with Low Spreads
VERIFIED Low spreads are crucial for reducing trading costs. Explore top Forex brokers offering competitive spreads and high leverage. Compare options for EUR/USD, GBP/USD, USD/JPY, and Gold.