|

GBP/USD Price Analysis: Drops below 1.2100 as risk-off impulse spikes further

  • GBP/USD has slipped below the crucial support of 1.2100 amid the risk-aversion theme.
  • The Pound Sterling bulls will dance to the tunes of the UK’s preliminary GDP (Q4) data.
  • A downside move below the demand zone by the Cable indicates weakness ahead.

The GBP/USD pair has surrendered the round-level support of 1.2100 in the Asian session. The Cable has witnessed selling pressure and has lost half of the gains added on Thursday. The downside pressure in the Pound Sterling has been triggered as investors have underpinned the risk-aversion theme ahead of the release of the United States Consumer Price Index (CPI).

The US Dollar Index has climbed above 103.04 as the street believes that January’s upbeat labor market data could propel a surprise rise in the inflation data to be released on Tuesday. Meanwhile, the Pound Sterling bulls will dance to the tunes of the United Kingdom’s preliminary Gross Domestic Product (GDP) (Q4) data.

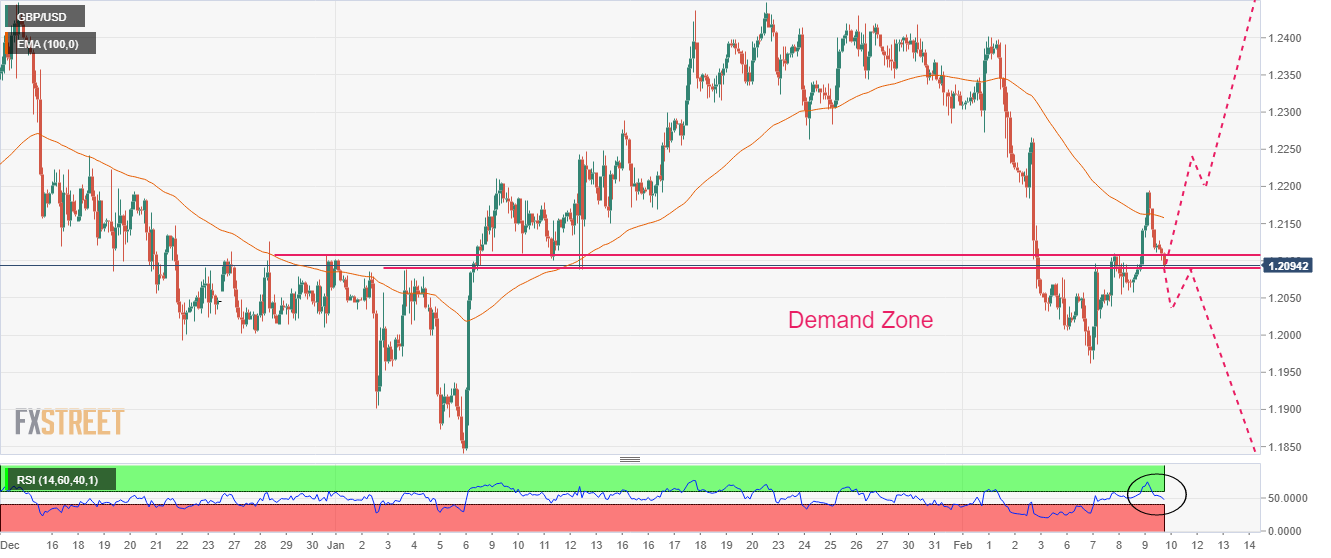
GBP/USD has corrected to near the demand zone placed in a narrow range of 1.2090-1.2108 on a two-hour chart. The Cable has dropped after facing barricades around the 100-period Exponential Moving Average (EMA) at 1.2158, which adds to the downside filters.

Meanwhile, the Relative Strength Index (RSI) (14) has failed to sustain into the bullish range of 60.00-80.00, which indicates an absence of strength in the Pound Sterling bulls.

A further decline in the Cable below February 9 low at 1.2057 will drag the asset toward January 3 low at 1.1900 followed by horizontal support placed from January 6 low around 1.1841.

On the contrary, a break above January 24 low at 1.2263 will support a bullish reversal and will drive the Cable towards February 2 high around 1.2400. A breach of the latter will send the major toward January 23 high at 1.2448.

GBP/USD two-hour chart

GBP/USD

Overview
Today last price1.2094
Today Daily Change-0.0022
Today Daily Change %-0.18
Today daily open1.2116
 
Trends
Daily SMA201.2266
Daily SMA501.2191
Daily SMA1001.1833
Daily SMA2001.1947
 
Levels
Previous Daily High1.2194
Previous Daily Low1.2057
Previous Weekly High1.2418
Previous Weekly Low1.205
Previous Monthly High1.2448
Previous Monthly Low1.1841
Daily Fibonacci 38.2%1.2142
Daily Fibonacci 61.8%1.2109
Daily Pivot Point S11.2051
Daily Pivot Point S21.1986
Daily Pivot Point S31.1914
Daily Pivot Point R11.2188
Daily Pivot Point R21.2259
Daily Pivot Point R31.2325

Author

Sagar Dua

Sagar Dua

FXStreet

Sagar Dua is associated with the financial markets from his college days. Along with pursuing post-graduation in Commerce in 2014, he started his markets training with chart analysis.

More from Sagar Dua
Share:

Editor's Picks

EUR/USD rises to 1.1800 neighborhood amid renewed USD selling and trade uncertainties

The EUR/USD pair regains positive traction during the Asian session on Wednesday and jumps to the 1.1800 neighborhood in the last hour, reversing the previous day's modest losses. The intraday move up is sponsored by the emergence of fresh US Dollar, which continues to be weighed down by persistent trade-related uncertainties.

GBP/USD remains stronger above 1.3500 following Trump’s State of the Union

GBP/USD remains in the positive territory for the fourth successive session, trading around 1.3510 during the Asian hours on Wednesday. The pair appreciates as the US Dollar remains subdued following US President Donald Trump’s first State of the Union address of his second administration before a joint session of Congress.

Gold re-attempts $5,200 amid tariffs and geopolitical woes

Gold buyers are back in the game early Wednesday after seeing a correction from monthly highs on Tuesday. The US Dollar slips after Trump’s SOTU fails to impress and as AI-driven worries ease. Dovish Fed bets also weigh.  Gold looks north so long as the key 61.8% Fibo resistance at $5,142 holds on the daily chart.

Bitcoin, Ethereum and Ripple post cautious recovery amid downside risks

Bitcoin, Ethereum, and Ripple are posting a cautious recovery on Wednesday following a market correction earlier this week.  BTC is approaching a key breakdown level, while ETH and XRP are rebounding from crucial support levels.

The Citrini report: How a debatable AI narrative can shake Wall Street

That AI-related headline alone was enough to rattle investors.US stocks slid sharply on Monday after a widely circulated Citrini Research memo outlined a hypothetical “2028 Global Intelligence Crisis”, warning that rapid AI adoption could push US unemployment into double digits as early as by mid-2028.

XRP pressured by weak ETF flows and declining retail interest

Ripple (XRP) is edging lower, trading above its intraday low of $1.32 at the time of writing on Tuesday. The decline from its weekly opening of $1.39 reflects heightened volatility in the broader cryptocurrency market, accentuated by tariff-triggered uncertainty.