|

GBP/USD Price Analysis: Descending triangle keeps buyers hopeful around 1.2250

  • GBP/USD dribbles inside a bullish chart pattern after two-day inaction.
  • Firmer RSI, horizontal support add strength to the bullish bias.
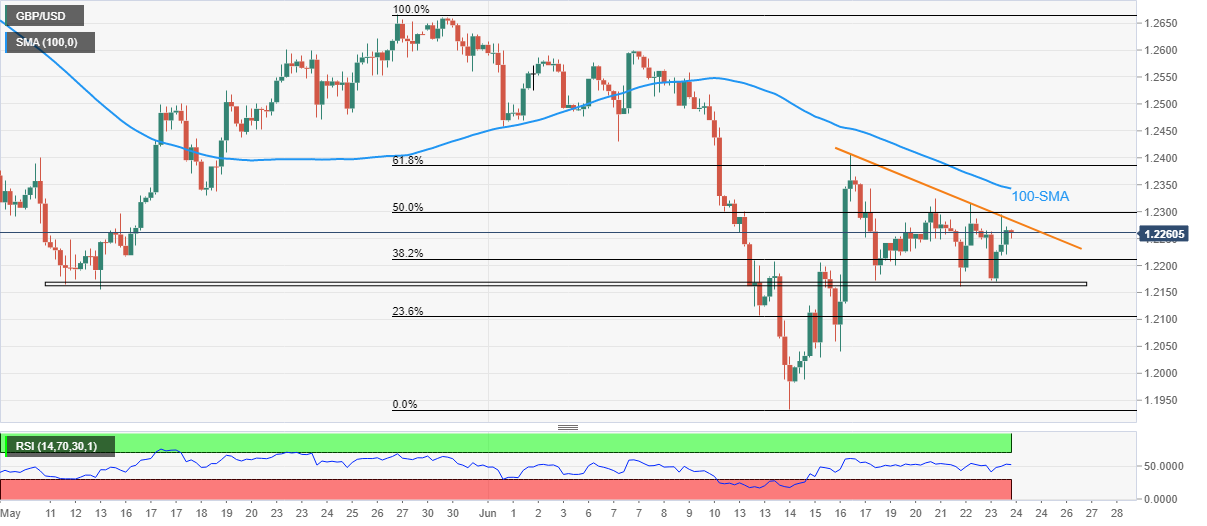
  • 100-SMA acts as an extra filter to the north, bears could aim for yearly low on breaking 1.2160.

GBP/USD treads water around 1.2260 during Friday’s Asian morning, following the last two days’ dormancy inside a falling triangle bullish formation.

Adding strength to the Cable pair’s upside bias is the firmer RSI and a six-week-old horizontal support area that also comprises the stated triangle’s lower line.

That said, the GBP/USD buyers need validation from 1.2285 to trigger the upside momentum. Even so, the 100-SMA could test the bulls around 1.2345.

In a case where the quote rises past 1.2345, the previous weekly top surrounding 1.2405 and multiple troughs marked during late May and early June, around 1.2470 could challenge the pair’s further advances.

On the contrary, a downside break of the 1.2160 could quickly fetch the GBP/USD prices towards the 23.6% Fibonacci retracement level of the May-June downside, near 1.2100.

The bearish bias, if persist past 1.2100, won’t hesitate to challenge the yearly low surrounding 1.1933. During the fall, the 1.2000 psychological magnet could offer an intermediate halt.

Overall, GBP/USD is up for consolidating recent losses ahead of the UK Retail Sales for May.

GBP/USD: Four-hour chart

Trend: Further upside expected

Additional important levels

Overview
Today last price1.2259
Today Daily Change-0.0007
Today Daily Change %-0.06%
Today daily open1.2266
 
Trends
Daily SMA201.241
Daily SMA501.2514
Daily SMA1001.2898
Daily SMA2001.3206
 
Levels
Previous Daily High1.2315
Previous Daily Low1.2161
Previous Weekly High1.2407
Previous Weekly Low1.1934
Previous Monthly High1.2667
Previous Monthly Low1.2155
Daily Fibonacci 38.2%1.222
Daily Fibonacci 61.8%1.2256
Daily Pivot Point S11.218
Daily Pivot Point S21.2094
Daily Pivot Point S31.2026
Daily Pivot Point R11.2334
Daily Pivot Point R21.2401
Daily Pivot Point R31.2487

Author

Anil Panchal

Anil Panchal

FXStreet

Anil Panchal has nearly 15 years of experience in tracking financial markets. With a keen interest in macroeconomics, Anil aptly tracks global news/updates and stays well-informed about the global financial moves and their implications.

More from Anil Panchal
Share:

Editor's Picks

EUR/USD keeps the offered stance just above 1.1700

EUR/USD is coming under heavy selling pressure in what has been a rather grim start to the new trading week, with the pair now trading close to the 1.1700 support area as the US Dollar stages a solid rebound. The prevailing flight to safety mood continues to favour the Greenback, as investors react to the escalating conflict in the Middle East and trim risk exposure across the board.

GBP/USD hits new yearly lows near 1.3300

GBP/USD adds to the recent bearish tone, approaching to the key 1.3300 support to reach fresh YTD troughs against the backdrop of the robust performance of the US Dollar. Indeed, Cable’s decline comes amid the firm demand for the safe-haven space in the wake of the US and Israel attacks to Iran.

Gold trims losses, back below $5,400

Gold now surrenders part of the earlier advance past the $5,400 mark per troy ounce at the beginning of the week. Indeed, the precious metal’s strong uptick remains fuelled by increasing geopolitical tensions in the Middle East amid the intense demand for safer assets.

Bitcoin on brink of breakdown amid US-Iran war

Bitcoin (BTC) remains under pressure near the key support level of $65,700. Trading at $66,400 at the time of writing on Monday, a breakdown below this critical level would suggest a deeper correction ahead.

The Fed is finally talking about AI – Here's why it matters for the US Dollar

AI is moving from earnings calls into the heart of monetary policy discussions, forcing Federal Reserve officials to confront a new question: How to act if AI reshapes inflation, employment and interest rates at the same time?

Grass 20% bullish breakout defies broader market weakness

Grass (GRASS) is edging up above $0.30 at the time of writing on Monday. The token’s notable 20% intraday surge stands out amid heightened volatility in the broader crypto market.