GBP/USD Price Analysis: Consolidates near multi-month low, below 1.2400 ahead of UK CPI
- GBP/USD continues with its struggle to register any recovery from a multi-month trough.
- Traders opt to wait for the UK CPI and FOMC decision, ahead of Thursday's BoE meeting.
- The setup favours bears and suggests that the path of least resistance is to the downside.

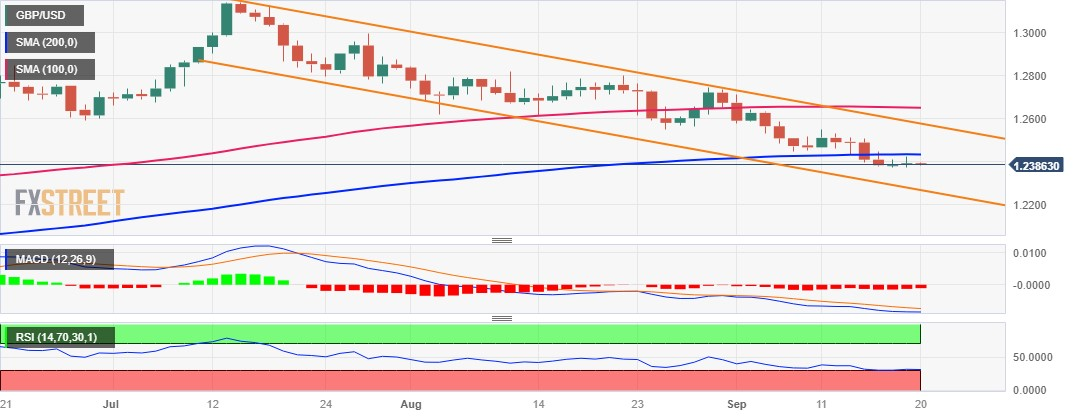
The GBP/USD pair extends the previous day's rejection slide from the vicinity of a technically significant 200-day SMA, around the 1.2425-1.2430 region, and remains on the defensive through the Asian session on Wednesday. Spot prices currently trade below the 1.2400 round-figure mark, well within the striking distance of the lowest level since early June.
The British Pound (GBP) is undermined by reduced bets for more aggressive policy tightening by the Bank of England (BoE). This, along with the underlying bullish sentiment surrounding the US Dollar (USD), continues to act as a headwind for the GBP/USD pair. Traders, however, seem reluctant to place aggressive bets and opt to wait on the sidelines ahead of the latest UK consumer inflation figures. This will be followed by the highly-anticipated FOMC policy decision, due later during the US session and the BoE meeting on Thursday.
From a technical perspective, the Relative Strength Index (RSI) on the daily chart is already flashing slightly oversold conditions and helping limit the downside for the GBP/USD pair ahead of the key data/central bank event risks. That said, the lack of any meaningful buying and the overnight failure near the very important 200-day SMA suggests that the recent bearish trend might still be far from being over. Moreover, the recent decline along a downward-sloping channel points to a well-established downtrend and favours bearish traders.
The aforementioned technical setup suggests that the path of least resistance for the GBP/USD pair is to the downside. Hence, a subsequent fall back towards testing the May monthly swing low, around the 1.2310-1.2300 area, looks likely a distinct possibility. The said area coincides with the lower boundary of the aforementioned trend channel, which if broken decisively will set the stage for an extension of the depreciating move. Spot prices might then fall to the 1.2200 mark en route to the next relevant support near the 1.2150-1.2140 zone.
On the flip side, any recovery attempt beyond the 1.2400 mark might continue to confront stiff resistance near the 1.2430-1.2435 region, or the 200-day SMA. A sustained strength beyond might trigger a short-covering rally and allow the GBP/USD pair to reclaim the 1.2500 psychological mark. The momentum could get extended further, though might attract fresh sellers and remain capped near last week's swing high, around the 1.2545-1.2550 area. The latter should act as a pivotal point, which if cleared might shift the bias in favour of bulls.
The GBP/USD pair might then climb to challenge the ascending trend-channel hurdle, currently pegged just below the 1.2600 mark. This is followed by the 100-day SMA barrier, currently pegged around mid-1.26900s, which if cleared decisively will suggest that spot prices have formed a near-term bottom and pave the way for some meaningful appreciating move.
GBP/USD daily chart
Technical levels to watch
Author

Haresh Menghani
FXStreet
Haresh Menghani is a detail-oriented professional with 10+ years of extensive experience in analysing the global financial markets.


