|

GBP/USD Price Analysis: Clings to modest intraday gains, not out of the woods yet

  • GBP/USD staged a modest bounce from two-week lows, though lacked any follow-through.
  • Descending triangle support break and the formation of double-top favours bearish traders.
  • Sustained weakness below the 1.3835 support area will reaffirm the near-term negative bias.

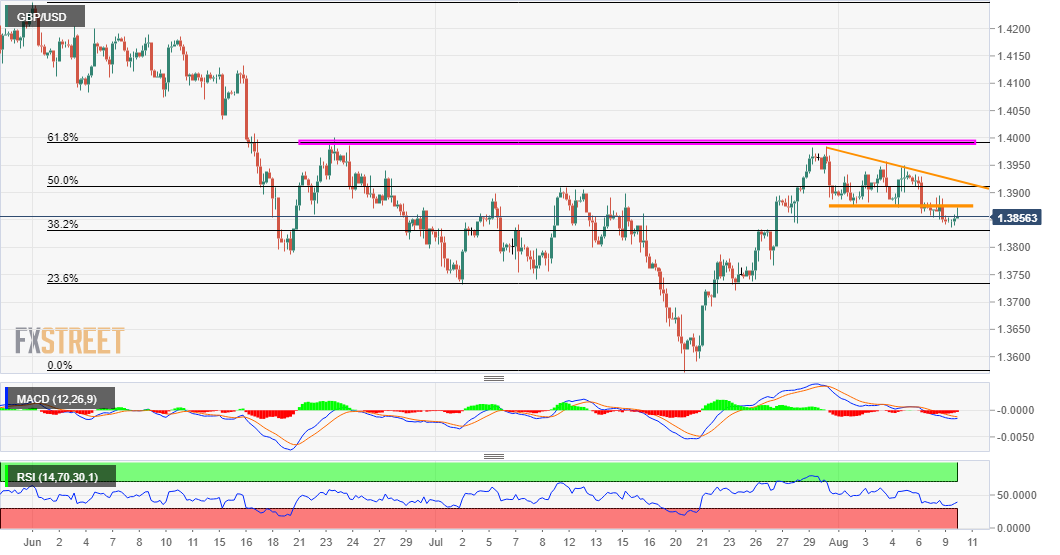
The GBP/USD pair found some support near the 38.2% Fibonacci level of the 1.4249-1.3572 downfall and staged a modest bounce from two-week lows, around the 1.3835 region touched earlier this Tuesday.

The uptick lacked any obvious fundamental catalyst and remained capped near the 1.3870 horizontal support breakpoint. The mentioned level, along with a downward sloping trend-line resistance constituted the formation of a descending triangle on short-term charts.

Apart from this, the recent pullback from the vicinity of the 1.4000 psychological mark formed a bearish double-top on the daily chart. The combination of bearish patterns suggests that the recent strong rebound from the lowest level since early February has run out of steam.

Hence, any subsequent move up beyond the mentioned horizontal support breakpoint might still be seen as a selling opportunity near the 1.3900 mark. This should cap the GBP/USD pair near the 1.3910-15 confluence hurdle, comprising of 50% Fibo. level and the 100-day SMA.

On the flip side, some follow-through selling below the 1.3835 region (38.2% Fibo. level) will reaffirm the bearish bias turn the GBP/USD pair vulnerable to break below the 1.3800 mark. The downward trajectory could then get extended towards the 23.6% Fibo., around the 1.3730-25 area.

GBP/USD 4-hour chart

fxsoriginal

Technical levels to watch

GBP/USD

Overview
Today last price1.386
Today Daily Change0.0013
Today Daily Change %0.09
Today daily open1.3847
 
Trends
Daily SMA201.383
Daily SMA501.3913
Daily SMA1001.3923
Daily SMA2001.3763
 
Levels
Previous Daily High1.3894
Previous Daily Low1.3841
Previous Weekly High1.3958
Previous Weekly Low1.3861
Previous Monthly High1.3984
Previous Monthly Low1.3572
Daily Fibonacci 38.2%1.3861
Daily Fibonacci 61.8%1.3874
Daily Pivot Point S11.3827
Daily Pivot Point S21.3807
Daily Pivot Point S31.3773
Daily Pivot Point R11.3881
Daily Pivot Point R21.3914
Daily Pivot Point R31.3934

Author

Haresh Menghani

Haresh Menghani is a detail-oriented professional with 10+ years of extensive experience in analysing the global financial markets.

More from Haresh Menghani
Share:

Markets move fast. We move first.

Orange Juice Newsletter brings you expert driven insights - not headlines. Every day on your inbox.

By subscribing you agree to our Terms and conditions.

Editor's Picks

EUR/USD clings to small gains near 1.1750

Following a short-lasting correction in the early European session, EUR/USD regains its traction and clings to moderate gains at around 1.1750 on Monday. Nevertheless, the pair's volatility remains low, with investors awaiting this weeks key data releases from the US and the ECB policy announcements.

GBP/USD edges higher toward 1.3400 ahead of US data and BoE

GBP/USD reverses its direction and advances toward 1.3400 following a drop to the 1.3350 area earlier in the day. The US Dollar struggles to gather recovery momentum as markets await Tuesday's Nonfarm Payrolls data, while the Pound Sterling holds steady ahead of the BoE policy announcements later in the week.

Gold pulls away from session high, holds above $4,300

Gold loses its bullish momentum and retreats below $4,350 after testing this level earlier on Monday. XAU/USD, however, stays in positive territory as the US Dollar remains on the back foot on growing expectations for a dovish Fed policy outlook next year.

Solana consolidates as spot ETF inflows near $1 billion signal institutional dip-buying

Solana price hovers above $131 at the time of writing on Monday, nearing the upper boundary of a falling wedge pattern, awaiting a decisive breakout. On the institutional side, demand for spot Solana Exchange-Traded Funds remained firm, pushing total assets under management to nearly $1 billion since launch. 

Big week ends with big doubts

The S&P 500 continued to push higher yesterday as the US 2-year yield wavered around the 3.50% mark following a Federal Reserve (Fed) rate cut earlier this week that was ultimately perceived as not that hawkish after all. The cut is especially boosting the non-tech pockets of the market.

Solana Price Forecast: SOL consolidates as spot ETF inflows near $1 billion signal institutional dip-buying

Solana (SOL) price hovers above $131 at the time of writing on Monday, nearing the upper boundary of a falling wedge pattern, awaiting a decisive breakout.