• GBP/USD tests key-support trendline turned resistance at around 1.2730.
  • Technical outlook shows momentum favoring buyers, but unable to sustain gains above 1.2800.
  • Key resistance at 1.2739 and 1.2800, with support levels at 1.2700, 1.2643, and 1.2617.

The Pound Sterling modestly gains versus the Greenback on Wednesday, amid thin liquidity conditions, due to US traders being in observance of Juneteenth. Therefore, with US markets being closed, the GBP/USD could remain subdued, and trade at 1.2729 at the time of writing.

GBP/USD Price Analysis: Technical outlook

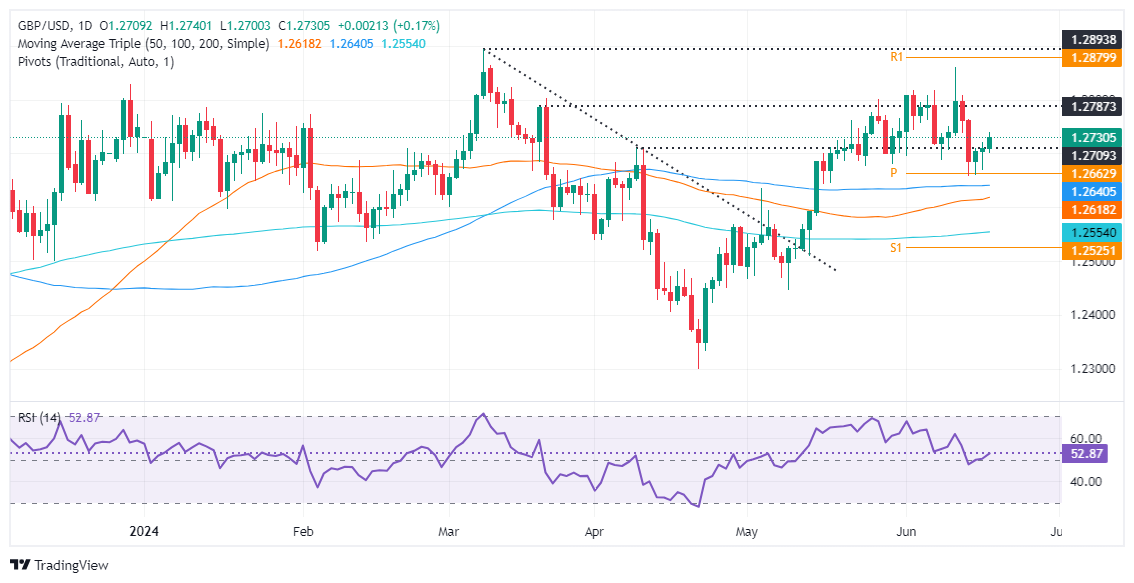
After hitting a three-month high at 1.2860, the GBP/SD dropped more than 100 pips and cleared a support trendline drawn from lows of May 17 that passes at around 1.2730.

Although momentum favors buyers with the Relative Strength Index (RSI) above the 50-neutral line, the major has failed to sustain the uptrend above 1.2800.

Risk events, like the latest inflation report, could not lift the GBP/USD close to 1.2800. That, along with Thursday’s Bank of England decision, will keep the pair trading volatile in the upcoming days.

Key resistance levels lie at 1.2739, the current week’s high, followed by 1.2800. Once cleared, the next stop would be the monthly high of 1.2860.

Conversely, if GBP/USD stumbles past 1.2700, that will expose the confluence of technical indicators, like the May 3 high turned support and the 50-day moving average (DMA) at 1.2643/39, ahead of the 50-DMA at 1.2617. Further losses lie once cleared, like the 1.2600 figure and the 200-DMA at 1.2550.

GBP/USD Price Action – Daily Chart

GBP/USD

Overview
Today last price 1.273
Today Daily Change 0.0021
Today Daily Change % 0.17
Today daily open 1.2709
 
Trends
Daily SMA20 1.2743
Daily SMA50 1.2614
Daily SMA100 1.264
Daily SMA200 1.2553
 
Levels
Previous Daily High 1.2721
Previous Daily Low 1.2669
Previous Weekly High 1.286
Previous Weekly Low 1.2657
Previous Monthly High 1.2801
Previous Monthly Low 1.2446
Daily Fibonacci 38.2% 1.2701
Daily Fibonacci 61.8% 1.2689
Daily Pivot Point S1 1.2679
Daily Pivot Point S2 1.2648
Daily Pivot Point S3 1.2627
Daily Pivot Point R1 1.273
Daily Pivot Point R2 1.2752
Daily Pivot Point R3 1.2782


Share: Feed news

Information on these pages contains forward-looking statements that involve risks and uncertainties. Markets and instruments profiled on this page are for informational purposes only and should not in any way come across as a recommendation to buy or sell in these assets. You should do your own thorough research before making any investment decisions. FXStreet does not in any way guarantee that this information is free from mistakes, errors, or material misstatements. It also does not guarantee that this information is of a timely nature. Investing in Open Markets involves a great deal of risk, including the loss of all or a portion of your investment, as well as emotional distress. All risks, losses and costs associated with investing, including total loss of principal, are your responsibility. The views and opinions expressed in this article are those of the authors and do not necessarily reflect the official policy or position of FXStreet nor its advertisers. The author will not be held responsible for information that is found at the end of links posted on this page.

If not otherwise explicitly mentioned in the body of the article, at the time of writing, the author has no position in any stock mentioned in this article and no business relationship with any company mentioned. The author has not received compensation for writing this article, other than from FXStreet.

FXStreet and the author do not provide personalized recommendations. The author makes no representations as to the accuracy, completeness, or suitability of this information. FXStreet and the author will not be liable for any errors, omissions or any losses, injuries or damages arising from this information and its display or use. Errors and omissions excepted.

The author and FXStreet are not registered investment advisors and nothing in this article is intended to be investment advice.

Recommended content


Recommended content

Editors’ Picks

EUR/USD retreats to 1.0700 area following post-PCE jump

EUR/USD retreats to 1.0700 area following post-PCE jump

After spiking to a daily high of 1.0720 with the immediate reaction to US PCE inflation data, EUR/USD lost its traction and declined to the 1.0700 area. Investors remain cautious ahead of this weekend's French election and make it difficult for the Euro to gather strength.

EUR/USD News

GBP/USD stays below 1.2650 after US inflation data

GBP/USD stays below 1.2650 after US inflation data

GBP/USD struggles to preserve its bullish momentum and trades below 1.2650 in the American session on Friday. Earlier in the day, the data from the US showed that the annual core PCE inflation declined to 2.6% in May, limiting the USD's upside and helping the pair hold its ground.

GBP/USD News

Gold keeps its daily gains near $2,330 following US PCE data

Gold keeps its daily gains near $2,330 following US PCE data

Gold prices maintain their constructive bias around $2,330 after US inflation readings gauged by the PCE matched consensus in May and US yields advance slightly across the curve.

Gold News

BTC struggles around the $62,000 level

BTC struggles around the $62,000 level

Bitcoin price faces pullback resistance at the lower band of the descending wedge around $62,000. Ethereum price finds support at $3,288, the 61.8% Fibonacci retracement level. Ripple price faces resistance at $0.500, its daily resistance level.

Read more

French Elections Preview: Euro to suffer after the calm, as specter of extremists, uncertainty rise Premium

French Elections Preview: Euro to suffer after the calm, as specter of extremists, uncertainty rise

The first round of French parliamentary elections is set to trigger high uncertainty. Soothing messages from the far right and far left leave the Euro vulnerable to falls. Calm may return only after the second round of voting on  July 7.

Read more

Forex MAJORS

Cryptocurrencies

Signatures