|

GBP/USD Price Analysis: Bulls back in the driving seat through daily resistance

  • GBP/USD bulls are on the march and have burst through daily resistance.
  • The 4-hour chart's environment is now bullish as MACD crosses above zero.

The monthly chart is showing signs of exhaustion at a critical resistance level in the recent dollar strength and the subsequent drop in cable. 

However, there could still be some juice left in the price to the upside before a meaningful monthly downside correction. 

The following is a top-down analysis that illustrates the market's structure and price action across various time frames driving at a potential upside opportunity on the daily and 4-hour time frames. 
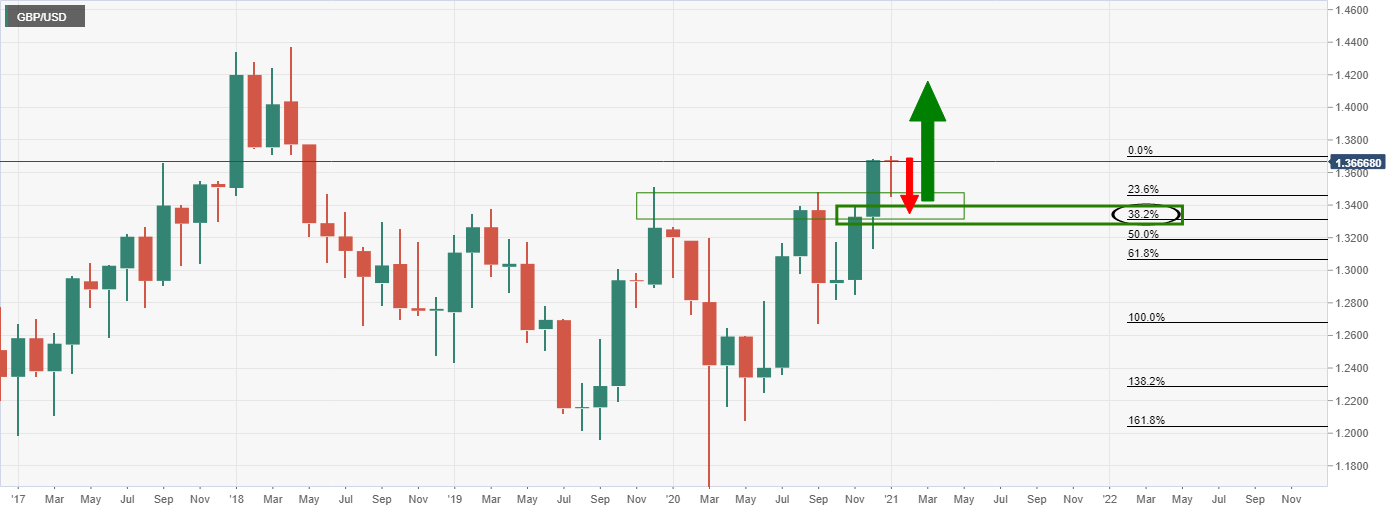
Monthly chart

Weekly chart

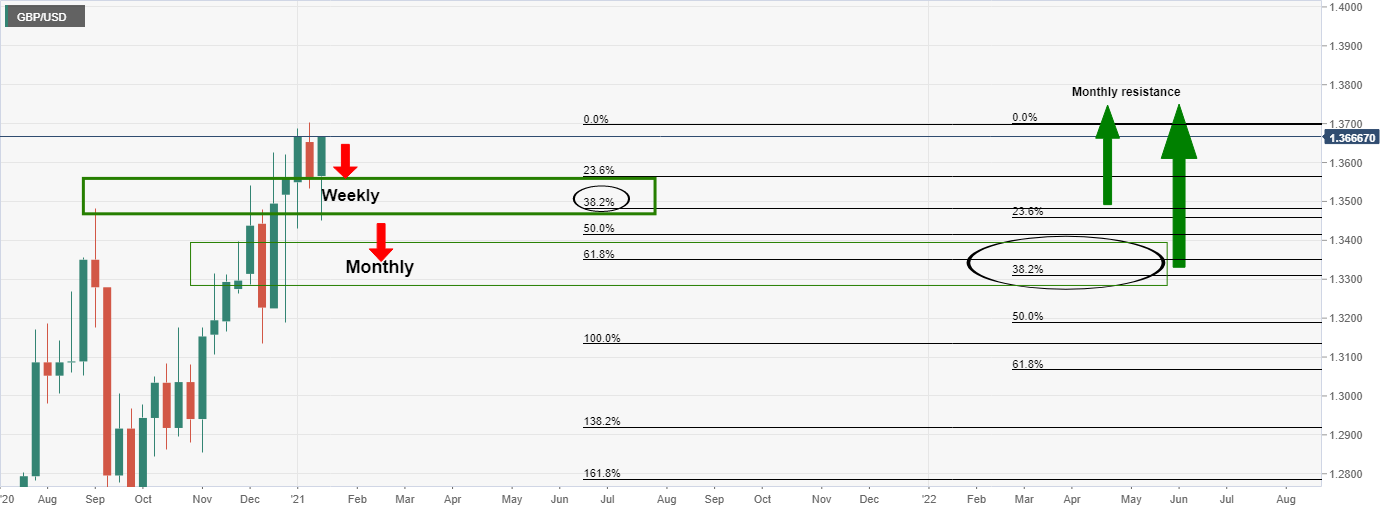
The weekly chart has already corrected a 38.2% Fibonacci retracement of the weekly bullish impulse. This is significant enough to expect a bullish continuation although there are still prospects of a downside continuation until at least a 38.2% Fibonacci retracement has been reached. 

Daily chart

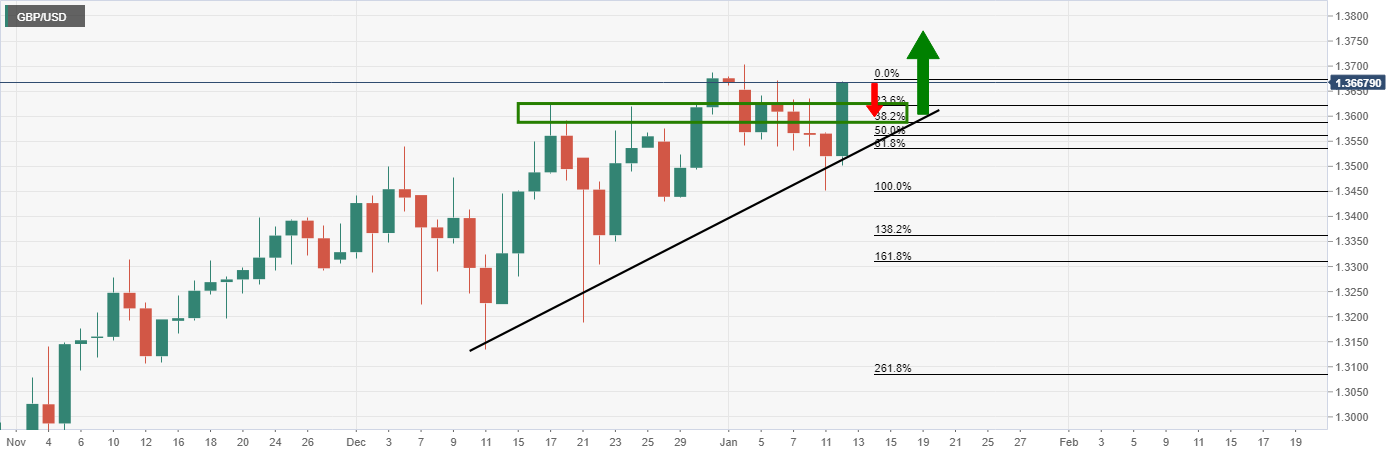
The recent break of the resistance is compelling.

The daily chart is now aligning with the weekly and monthly charts as the price moves away from dynamic trendline support.

Regardless of whether the monthly chart still needs to correct further, there are prospects for a daily continuation. 

4-hour chart

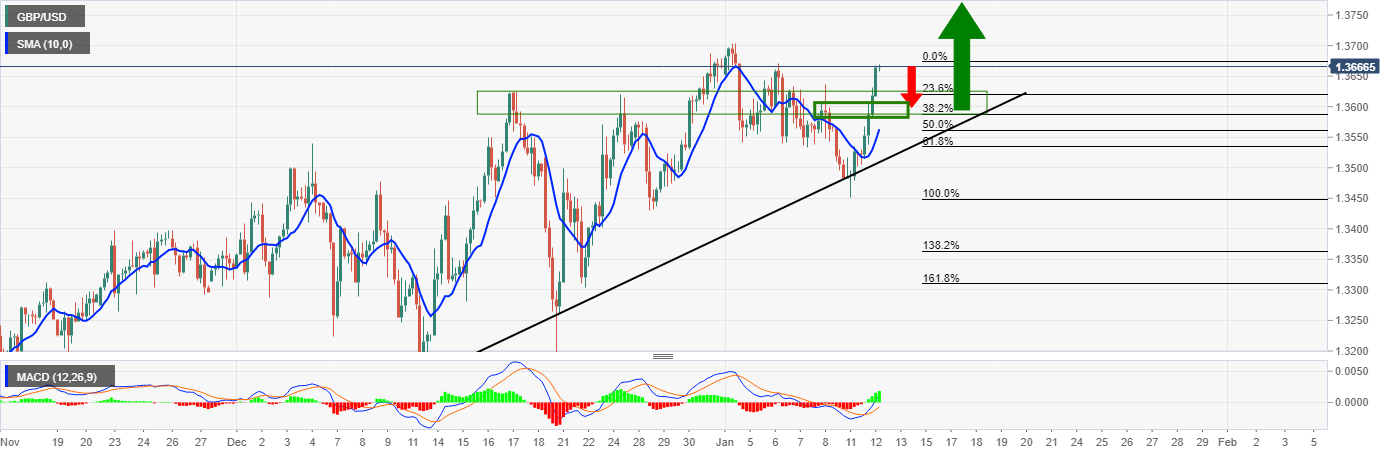
The 4-hour chart is showing bullish conditions with MACD above zero and the price rallying trough resistance and away from the 10 moving average. 

A pullback to restest the old resistance structure would now be expected to hold.

In doing so, then the monthly, weekly and daily alignments would reinforce the bullish bias on the lower time frame. 

Author

Ross J Burland

Ross J Burland, born in England, UK, is a sportsman at heart. He played Rugby and Judo for his county, Kent and the South East of England Rugby team.

More from Ross J Burland
Share:

Editor's Picks

EUR/USD remains bid near 1.1650 post-US ADP

Finally some respite for the risk complex see EUR/USD partially recover from the recent steep sell-off, this time hovering around the 1.1650 zone amid decent gains in a context of renewed selling pressure on the US Dollar. However, the duration and extension of this bounce should be put to the test amid the unabated tensions in the Middle East.

GBP/USD meets resistance around 1.3400

In line with its risk-linked peers, GBP/USD stages a modest comeback on Wednesday, although meeting some resistance around the 1.3400 neighbourhood. Cable’s humble recovery comes on the back of the fresh downward bias in the Greenback amid a marginal improvement in the global sentiment and steady geopolitical effervescence.

Gold flirts with $5,200 amid safe haven demand

Gold partially fades Tuesday’s sharp pullback, regaining the $5,200 mark per troy ounce on the back of the resurgence of investors’ demand for the safe-haven space. The precious metal remains well propped up by the deterioration of the geopolitical scenario in the Middle East, while the softer tone in the US Dollar collaborates with the uptick.

Crypto Today: Bitcoin, Ethereum, XRP rebound amid mixed ETF flows

The cryptocurrency market is showing subtle recovery signs despite heightened global uncertainty following the United States (US) and Israel attacks on Iran and the subsequent retaliations that have morphed into a wider Middle East war.

Asian stocks fall as South Korea’s KOSPI slumps over 10%

Asian equities drop on Middle East tensions; the MSCI Asia Pacific Index falls up to 4%. South Korea’s KOSPI fell 10.71% near 5,170, with the Korean Won weakened past 1,500 per dollar.

Solana Price Forecast: SOL consolidation near resistance as ETF inflows offer mild support

Solana price is facing slight rejection as it approaches the upper boundary of the consolidation range at around $88 on Wednesday. Institutional demand is strengthening as spot Exchange Traded Funds recorded two consecutive inflows so far this week.