GBP/USD Price Analysis: Bulls await a sustained move beyond 1.3800 confluence
- GBP/USD gained traction for the second consecutive session on Thursday.
- Dovish Fed expectations undermined the USD and remained supportive.
- The set-up supports prospects for a further near-term appreciating move.

The GBP/USD pair refreshed daily tops heading into the North American session, with bulls still awaiting a sustained move beyond the 1.3800 mark. The mentioned handle coincides with the very important 200-day SMA and should now act as a key pivotal point for short-term traders.
The US dollar was seen consolidating its recent losses to one-month lows amid uncertainty over the likely timing of the Fed's tapering plan. This was evident from some follow-through decline in the US Treasury bond yields. Apart from this, the underlying bullish tone in the financial markets undermined the safe-haven greenback and pushed the GBP/USD pair higher for the second consecutive session on Thursday.
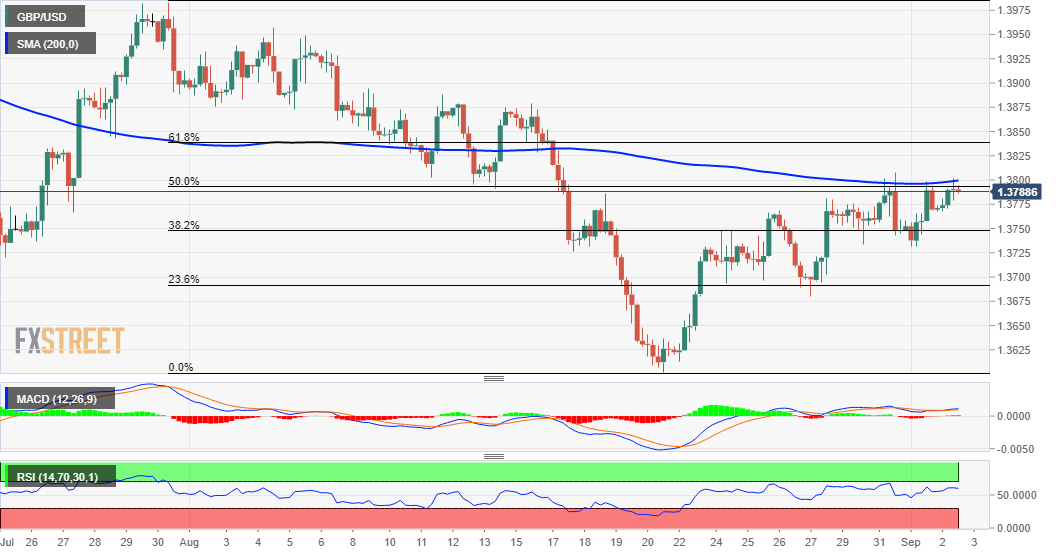
Looking at the technical picture, the GBP/USD pair, so far, has struggled to break through a confluence hurdle comprising of 200-period SMA on the 4-hour chart and the 50% Fibonacci level of the 1.3984-1.3602. A sustained move beyond will be seen as a fresh trigger for bullish traders and set the stage for an extension of the recent bounce from the 1.3600 round-figure mark, or one-month low touched on August 20.
Meanwhile, technical indicators on hourly charts maintained their bullish bias and are still far from being in the overbought territory. Moreover, oscillators on the daily chart have just started moving into the positive territory. The set-up supports prospects for an eventual breakthrough the mentioned barrier.
That said, it will still be prudent to wait for some follow-through buying beyond the 1.3800 mark before positioning for any further appreciating move. The GBP/USD pair might then accelerate the momentum towards the 61.8% Fibo. level, around the 1.3840 region en-route the next hurdle near the 1.3875-80 supply zone.
On the flip side, the 38.2% Fibo. level, around the 1.3750-45 region now seems to protect the immediate downside ahead of the weekly swing low, around the 1.3730 area touched on Wednesday. Failure to defend the mentioned support levels might prompt some technical selling and drag the GBP/USD pair below the 1.3700 mark.
The downward trajectory could further get extended towards intermediate support near the 1.3640 level before the GBP/USD pair eventually drops to challenge the 1.3600 round-figure mark.
GBP/USD 4-hour chart
Technical levels to watch
Author

Haresh Menghani
FXStreet
Haresh Menghani is a detail-oriented professional with 10+ years of extensive experience in analysing the global financial markets.


