GBP/USD Price Analysis: Breaches critical daily support, focus on Thursday’s close
- GBP/USD has breached the key support near 1.3740.
- Path of least resistance appears to the downside for the cable.
- RSI points south below the midline amid a looming bear cross.

GBP/USD is attacking the 1.3700 level, as a broad US dollar’s strength remains the key theme playing out in early European trading.
The cable suffers from hawkish FOMC minutes-led dollar’s strength as well as from slowing inflationary pressures in the UK and Brexit worries.
The cable is now trading at 1.3704, down 0.36% on the day, having finally breached the critical upward-sloping daily support line, now at 1.3739. The line connects the previous day’s low and July lows.
After defending that key support for two straight sessions, the bulls finally gave into the selling pressure this Thursday.
The downside calling came into being after the pair gave a daily closing below the 200- Daily Moving Average (DMA) at 1.3789 on Tuesday.
Further, the 14-day Relative Strength Index (RSI) points south below the midline, suggesting that the downside risks remain intact.
Adding credence to a potential move lower, the 50-DMA is fast approaching the 21-DMA, with a break lower to confirm a bear cross – a bearish technical signal.
A daily closing below the 1.3700 level could expose the July lows at 1.3672. Further south, the 1.3650 psychological level could be tested should the sellers extend their control.
GBP/USD: Daily chart
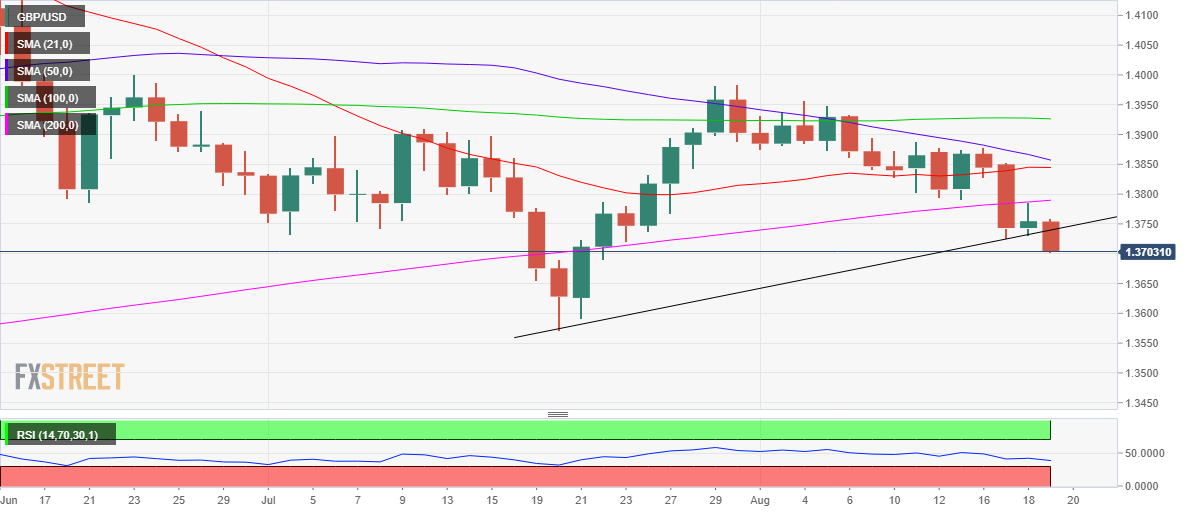
Alternatively, any rebound could need acceptance above the 200-DMA to ease the bearish pressures in the near term.
The horizontal 21-DMA at 1.3844 could act as a strong resistance on the road to recovery.
GBP/USD: Additional levels to consider
Author

Dhwani Mehta
FXStreet
Residing in Mumbai (India), Dhwani is a Senior Analyst and Manager of the Asian session at FXStreet. She has over 10 years of experience in analyzing and covering the global financial markets, with specialization in Forex and commodities markets.


