|

GBP/USD Price Analysis: Bounces off lows, trades with modest losses just below 1.3900

  • GBP/USD witnessed some selling on Wednesday, albeit showed some resilience at lower levels.
  • The formation of a symmetrical triangle points to indecision over the pair’s near-term trajectory.

The GBP/USD pair has managed to recover around 25-30 pips from the early European session swing lows and was last seen trading with modest losses, just below the 1.3900 mark.

The US dollar found some support from some strong follow-through uptick in the US Treasury bond yields. On the other hand, the British pound was weighed down by the UK political turmoil amid the controversy on funding arrangement for Prime Minister Boris Johnson's official apartment. That said, the optimism over the gradual reopening of the UK economy helped limit any deeper losses for the GBP/USD pair.

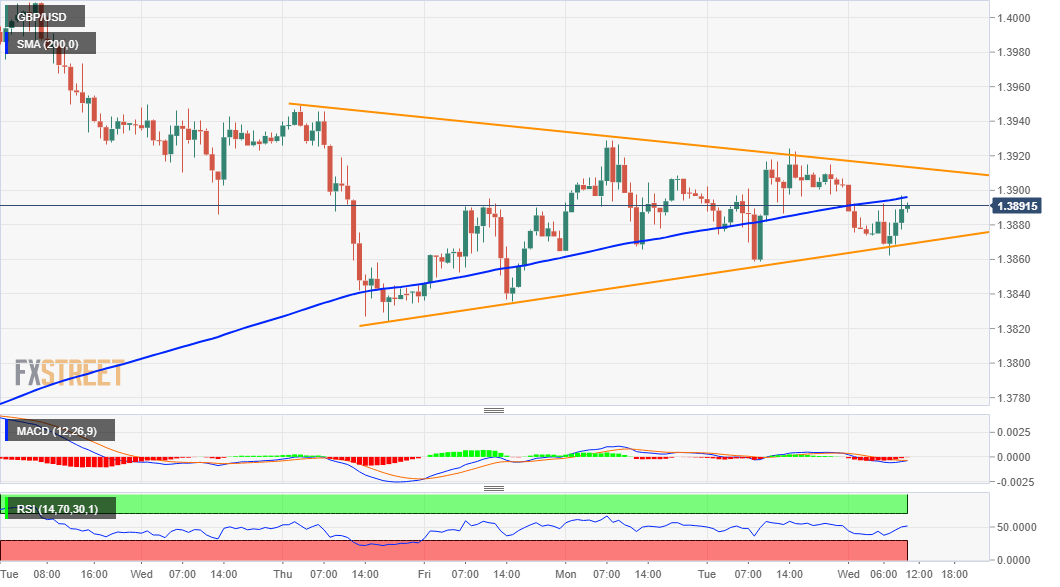
From a technical perspective, the pair on Tuesday struggled to break through the 1.3925-30 region, or a resistance marked by a one-week-old descending trend-line. The subsequent pullback, however, showed some resilience below another ascending trend-line. The combination of converging trendlines constitute the formation of a symmetrical triangle and points to indecision over the pair's near-term trajectory.

Meanwhile, technical indicators on daily/4-hour charts are holding with a mild positive bias and support prospects for a bullish breakout. That said, bulls might still be prudent to wait for a sustained break through the triangle resistance, around the 1.3925-30 region before placing fresh bets. The mentioned barrier coincides with weekly tops, above which the GBP/USD pair might aim to reclaim the key 1.4000 psychological mark.

Conversely, a convincing break through the symmetrical triangle support, around the 1.3860 region will shift the near-term bias in favour of bearish traders. The subsequent selling pressure has the potential to drag the GBP/USD pair further towards the 1.3825-20 support en-route last week's swing lows near the 1.3800 mark. Failure to defend the said support levels should pave the way for a slide back towards the 1.3715 support zone.

GBP/USD 1-hour chart

fxsoriginal

Technical levels to watch

GBP/USD

Overview
Today last price1.3889
Today Daily Change-0.0020
Today Daily Change %-0.14
Today daily open1.3909
 
Trends
Daily SMA201.3831
Daily SMA501.3874
Daily SMA1001.3744
Daily SMA2001.341
 
Levels
Previous Daily High1.3924
Previous Daily Low1.3859
Previous Weekly High1.4009
Previous Weekly Low1.381
Previous Monthly High1.4017
Previous Monthly Low1.3671
Daily Fibonacci 38.2%1.3899
Daily Fibonacci 61.8%1.3884
Daily Pivot Point S11.3871
Daily Pivot Point S21.3832
Daily Pivot Point S31.3805
Daily Pivot Point R11.3936
Daily Pivot Point R21.3963
Daily Pivot Point R31.4002

Author

Haresh Menghani

Haresh Menghani is a detail-oriented professional with 10+ years of extensive experience in analysing the global financial markets.

More from Haresh Menghani
Share:

Editor's Picks

EUR/USD struggles to regain momentum in the low1.1600s

EUR/USD is giving some signs of life in the aftermath of two severe days of losses on Wednesday, reclaiming the 1.1600 hurdle and above on the back of the resurgence of a mild selling bias around the US Dollar. Moving forward, the usual US weekly Claims will take centre stage on Thursday ahead of Friday’s crucial NFP data.
 

GBP/USD appears bid around 1.3370

GBP/USD reverses part of its recent multi-day decline, gathering some balance and managing to reach the 1.3400 region, where some initial resistance seems to have turned up. Cable’s uptick comes in response to some loss of momentum in the Greenback despite the geopolitical scenario remaining fragile.

Gold recovers modestly despite intensifying Middle East crisis

Gold keeps its daily gains well in place, although a break above the $5,200 mark per troy ounce still remains elusive on Wednesday. The yellow metal’s rebound comes in response to the persistent flight-to-safety amid intense geopolitical tensions in the Middle East and the bearish performance of the US Dollar.

XRP rises alongside peers as ETFs attract inflows

Ripple (XRP) is gaining upside momentum, trading above $1.40 at the time of writing on Wednesday. The remittance token is rising in tandem with major crypto assets, including Bitcoin (BTC), which has crossed above the pivotal $70,000 level, and Ethereum (ETH), which is holding above $2,000.

First Venezuela, now Iran: The US-China energy war escalates

At first glance, the latest escalation involving the United States with both Iran and Venezuela looks like another chapter in a long-running geopolitical story. But viewed through a broader strategic lens, something else may be unfolding: Energy.

Bittensor extends recovery despite retail demand slump

Bittensor, a leading Artificial Intelligence token, is aging up above $190 at the time of writing on Wednesday. Steady price increases characterise the broader crypto market, with Bitcoin holding above $71,000 and Ethereum above $2,000.