- GBP/USD picks up bids to refresh intraday high, pares biggest daily loss in over a week.
- One-week-old ascending trend line joins hidden bullish RSI divergence to favor Cable buyers.
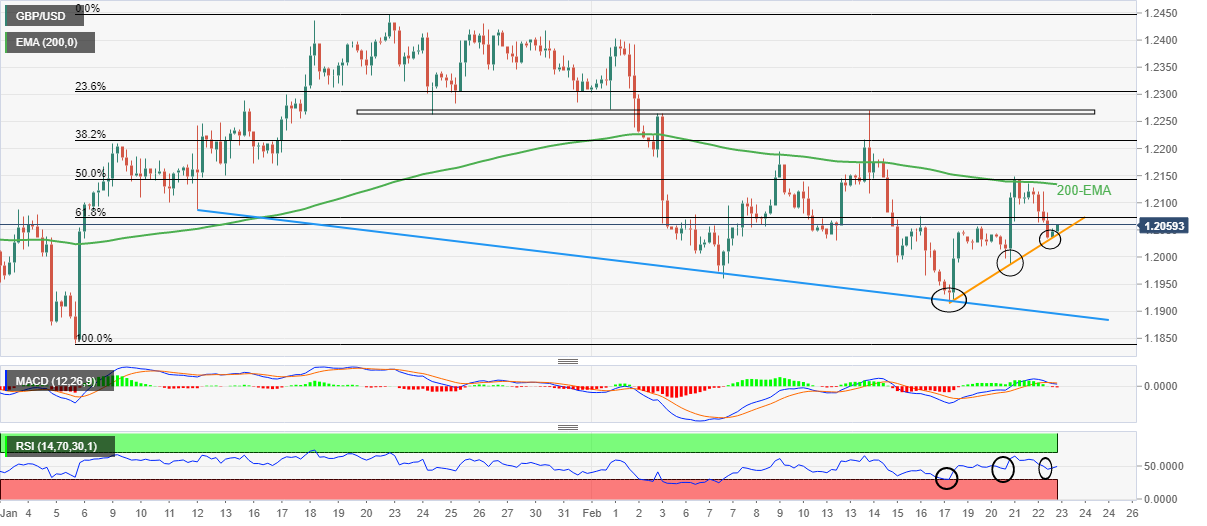
- 200-EMA appears important challenge for bulls, six-week-old support line can lure bears past 1.2040.
GBP/USD renews its intraday high near 1.2060 as it consolidates the biggest daily loss in more than a during early Thursday. In doing so, the Cable pair rebounds from a one-week-long ascending trend amid hidden bullish RSI divergence.
That said, the RSI (14) prints lower lows but the GBP/USD price prints higher lows, which in turn portrays a hidden bullish divergence and favors the quote’s latest bounce off the short-term key support line.
However, the 61.8% Fibonacci retracement level of the pair’s January 2023 up-moves, near 1.2075, acts as a validation point for the pair’s further upside.
Following that, the 200-bar Exponential Moving Average (EMA) level surrounding 1.2135 could challenge the GBP/USD bulls before directing them to the previous weekly high of near 1.2270.
In a case where the Cable pair remains firmer past 1.2270, January’s top around 1.2450 will be in the spotlight.
Alternatively, a downside break of the immediate support line, close to 1.2040 by the press time, could quickly recall the 1.2000 psychological magnet on the chart.
However, a descending support line from January 12, 2023, around 1.1900 at the latest, could probe the GBP/USD bears afterward.
GBP/USD: Four-hour chart
Trend: Further recovery expected
Information on these pages contains forward-looking statements that involve risks and uncertainties. Markets and instruments profiled on this page are for informational purposes only and should not in any way come across as a recommendation to buy or sell in these assets. You should do your own thorough research before making any investment decisions. FXStreet does not in any way guarantee that this information is free from mistakes, errors, or material misstatements. It also does not guarantee that this information is of a timely nature. Investing in Open Markets involves a great deal of risk, including the loss of all or a portion of your investment, as well as emotional distress. All risks, losses and costs associated with investing, including total loss of principal, are your responsibility. The views and opinions expressed in this article are those of the authors and do not necessarily reflect the official policy or position of FXStreet nor its advertisers. The author will not be held responsible for information that is found at the end of links posted on this page.
If not otherwise explicitly mentioned in the body of the article, at the time of writing, the author has no position in any stock mentioned in this article and no business relationship with any company mentioned. The author has not received compensation for writing this article, other than from FXStreet.
FXStreet and the author do not provide personalized recommendations. The author makes no representations as to the accuracy, completeness, or suitability of this information. FXStreet and the author will not be liable for any errors, omissions or any losses, injuries or damages arising from this information and its display or use. Errors and omissions excepted.
The author and FXStreet are not registered investment advisors and nothing in this article is intended to be investment advice.
Recommended content
Editors’ Picks

EUR/USD stays near 1.0400 in thin holiday trading
EUR/USD trades with mild losses near 1.0400 on Tuesday. The expectation that the US Federal Reserve will deliver fewer rate cuts in 2025 provides some support for the US Dollar. Trading volumes are likely to remain low heading into the Christmas break.

GBP/USD struggles to find direction, holds steady near 1.2550
GBP/USD consolidates in a range at around 1.2550 on Tuesday after closing in negative territory on Monday. The US Dollar preserves its strength and makes it difficult for the pair to gain traction as trading conditions thin out on Christmas Eve.

Gold holds above $2,600, bulls non-committed on hawkish Fed outlook
Gold trades in a narrow channel above $2,600 on Tuesday, albeit lacking strong follow-through buying. Geopolitical tensions and trade war fears lend support to the safe-haven XAU/USD, while the Fed’s hawkish shift acts as a tailwind for the USD and caps the precious metal.

IRS says crypto staking should be taxed in response to lawsuit
In a filing on Monday, the US International Revenue Service stated that the rewards gotten from staking cryptocurrencies should be taxed, responding to a lawsuit from couple Joshua and Jessica Jarrett.

2025 outlook: What is next for developed economies and currencies?
As the door closes in 2024, and while the year feels like it has passed in the blink of an eye, a lot has happened. If I had to summarise it all in four words, it would be: ‘a year of surprises’.

Best Forex Brokers with Low Spreads
VERIFIED Low spreads are crucial for reducing trading costs. Explore top Forex brokers offering competitive spreads and high leverage. Compare options for EUR/USD, GBP/USD, USD/JPY, and Gold.