|

GBP/USD Price Analysis: Bears look to seize control, break below 200 DMA awaited

  • GBP/USD meets with aggressive supply on Thursday and dives back closer to the weekly low.
  • The setup favours bears and supports prospects for an eventual break below the 200 DMA.
  • A sustained move beyond the 50-day SMA is needed to negate the near-term bearish outlook.

The GBP/USD pair comes under intense selling pressure on Thursday and extends its intraday downward trajectory heading into the North American session. The pair is currently placed below the mid-1.1900s, down over 0.60% for the day, and remains well within the striking distance of the weekly low touched on Monday.

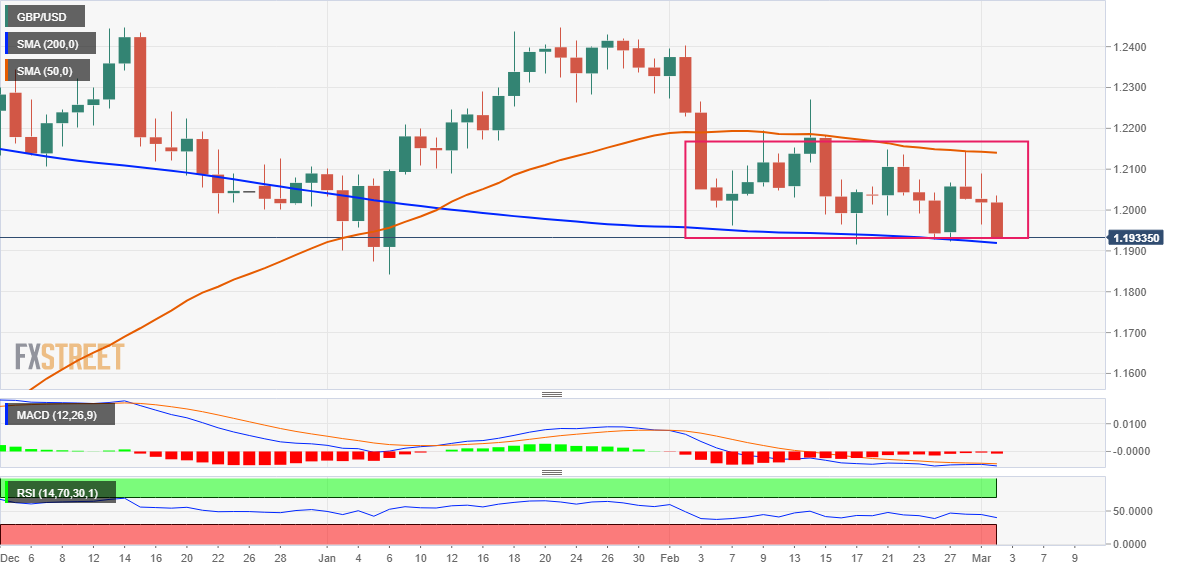
Looking at the broader picture, the GBP/USD pair is trading just above a technically significant 200-day Simple Moving Average (SMA) support, currently pegged around the 1.1920-1.1915 region.  The said area coincides with the lower end of a short-term trading range witnessed over the past two weeks or so, which constitutes the formation of a rectangle on the daily chart.

Given that oscillators on the daily have just started gaining negative traction, a convincing break below a technically significant SMA will be seen as a fresh trigger for bearish traders. The GBP/USD could then slide towards retesting the YTD low, around the 1.1840 area set in January, which if broken will complete a bearish double-top pattern formed near the 1.2445-1.2450 region.

On the flip side, attempted recovery moves might now confront stiff resistance near the 1.2000 psychological mark ahead of the daily swing high, around the 1.2035 region and the 1.2065-1.2070 supply zone. Any subsequent move-up could attract fresh sellers near the 1.2100 mark and remain capped near the 50-day SMA strong barrier, currently around the 1.2135-1.2140 area.

Some follow-through buying has the potential to lift the GBP/USD pair towards the 1.2200 round-figure mark en route to the February 14 swing high, around the 1.2265-1.2270 region. A sustained strength beyond the latter will suggest that the slide from the 1.2445-1.2450 supply zone has run its course and shift the near-term bias back in favour of bullish traders.

GBP/USD daily chart

fxsoriginal

Key levels to watch

GBP/USD

Overview
Today last price1.1955
Today Daily Change-0.0064
Today Daily Change %-0.53
Today daily open1.2019
 
Trends
Daily SMA201.2062
Daily SMA501.2143
Daily SMA1001.197
Daily SMA2001.1923
 
Levels
Previous Daily High1.209
Previous Daily Low1.1965
Previous Weekly High1.2148
Previous Weekly Low1.1928
Previous Monthly High1.2402
Previous Monthly Low1.1915
Daily Fibonacci 38.2%1.2013
Daily Fibonacci 61.8%1.2042
Daily Pivot Point S11.1959
Daily Pivot Point S21.19
Daily Pivot Point S31.1835
Daily Pivot Point R11.2084
Daily Pivot Point R21.2149
Daily Pivot Point R31.2208

Author

Haresh Menghani

Haresh Menghani is a detail-oriented professional with 10+ years of extensive experience in analysing the global financial markets.

More from Haresh Menghani
Share:

Markets move fast. We move first.

Orange Juice Newsletter brings you expert driven insights - not headlines. Every day on your inbox.

By subscribing you agree to our Terms and conditions.

Editor's Picks

EUR/USD clings to small gains near 1.1750

Following a short-lasting correction in the early European session, EUR/USD regains its traction and clings to moderate gains at around 1.1750 on Monday. Nevertheless, the pair's volatility remains low, with investors awaiting this weeks key data releases from the US and the ECB policy announcements.

GBP/USD edges higher toward 1.3400 ahead of US data and BoE

GBP/USD reverses its direction and advances toward 1.3400 following a drop to the 1.3350 area earlier in the day. The US Dollar struggles to gather recovery momentum as markets await Tuesday's Nonfarm Payrolls data, while the Pound Sterling holds steady ahead of the BoE policy announcements later in the week.

Gold pulls away from session high, holds above $4,300

Gold loses its bullish momentum and retreats below $4,350 after testing this level earlier on Monday. XAU/USD, however, stays in positive territory as the US Dollar remains on the back foot on growing expectations for a dovish Fed policy outlook next year.

Solana consolidates as spot ETF inflows near $1 billion signal institutional dip-buying

Solana price hovers above $131 at the time of writing on Monday, nearing the upper boundary of a falling wedge pattern, awaiting a decisive breakout. On the institutional side, demand for spot Solana Exchange-Traded Funds remained firm, pushing total assets under management to nearly $1 billion since launch. 

Big week ends with big doubts

The S&P 500 continued to push higher yesterday as the US 2-year yield wavered around the 3.50% mark following a Federal Reserve (Fed) rate cut earlier this week that was ultimately perceived as not that hawkish after all. The cut is especially boosting the non-tech pockets of the market.

Solana Price Forecast: SOL consolidates as spot ETF inflows near $1 billion signal institutional dip-buying

Solana (SOL) price hovers above $131 at the time of writing on Monday, nearing the upper boundary of a falling wedge pattern, awaiting a decisive breakout.