GBP/USD Price Analysis: Bears aim for 1.3290-75 key support zone
- GBP/USD stays pressured around yearly low after four-day downtrend.
- Bearish MACD signals, sustained trading below September 2020 peak favor sellers.
- 100-week SMA, four-month-old support line offers a tough nut to crack for the bears.
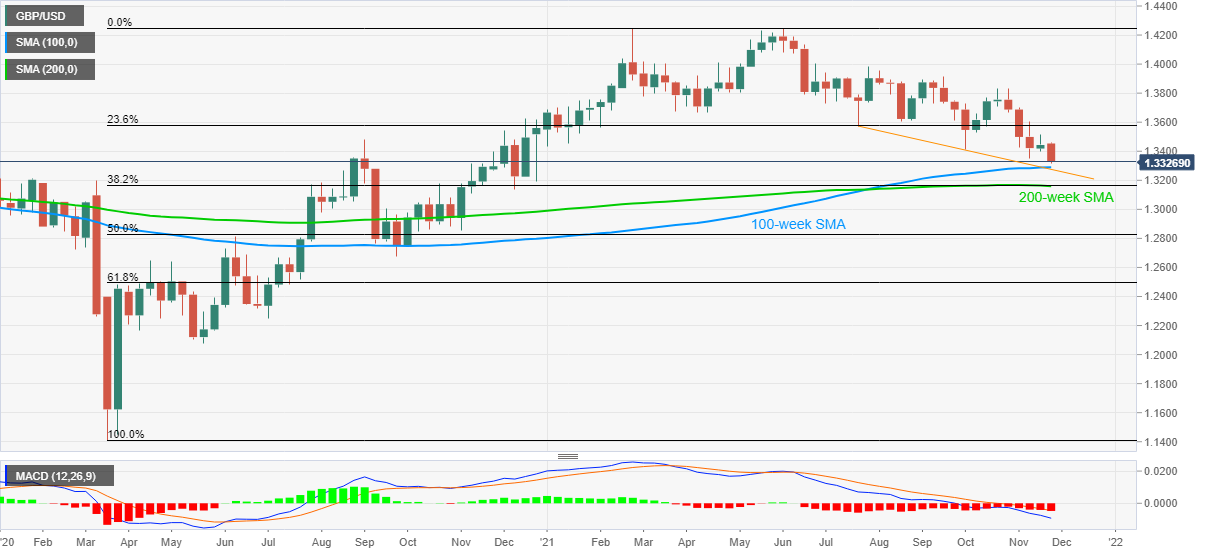
GBP/USD grinds lower around the yearly bottom surrounding 1.3320 amid the initial Asian session on Thursday, after declining for consecutive four days.
Given the cable pair’s failures to rebound following the downside break of the September 2020 high, coupled with the bearish MACD signals, sellers are likely to keep the reins.
However, a convergence of the 100-week SMA and a descending trend line from late July, around 1.3290-75 appears a major challenge for the pair bears.
Even if the quote drops past 1.3275, the 200-week SMA and 38.2% Fibonacci retracement (Fibo.) of March 2020 to June 2021 upside, near 1.3165-60, will act as an additional puzzle for the GBP/USD sellers to solve.
Meanwhile, corrective pullback remains elusive until crossing September 2020 top of 1.3482.
Adding to the upside filters is the 23.6% Fibo. level near 1.3580 and a monthly high surrounding 1.3700.
GBP/USD: Weekly chart
Trend: Limited downside expected
Author

Anil Panchal
FXStreet
Anil Panchal has nearly 15 years of experience in tracking financial markets. With a keen interest in macroeconomics, Anil aptly tracks global news/updates and stays well-informed about the global financial moves and their implications.


