- GBP/JPY continues to deflate, falling sharply on Thursday.
- Japanese Retail Sales came in as expected, with revisions.
- Japan’s Unemployment Rate to wrap up the trading week.
GBP/JPY fell back towards the 189.00 handle on Thursday after Yen (JPY) markets stepped higher following a Japanese Retail Sales print that came in at expectations, and previous data saw mixed revisions. UK data remains thin on the economic calendar this week, and Yen traders will be looking ahead to next Tuesday’s Japanese Tokyo Consumer Price Index (CPI).
Japan’s Retail Sales came in at 2.3% for the year ended in January, meeting market forecasts while the previous period saw an upside revision from 2.1% to 2.4%. The MoM figure also recovered to 0.8% after the previous month saw a sharp downside revision to -2.6% from -0.8%.
Japanese Industrial Production in January also declined to -7.5%, missing the -7.3% forecast and falling back from the previous print of 1.4%.
Next up for economic calendar watchers will be Japan’s Unemployment Rate due early Friday, which is forecast to hold steady at 2.4%. Japanese preliminary inflation from the Tokyo CPI is slated for next Tuesday.
GBP/JPY technical outlook
GBP/JPY is down eight-tenths of one percent on Thursday as the pair grinds back towards the 189.00 handle. The pair has slid from the week’s early high near 191.30. GBP/JPY is trading back into a heavy supply zone built around 189.00.
Despite near-term weakness, the pair is buried deep in bull country, with daily candles trading well above the 200-day Simple Moving Average (SMA) at 183.43.
GBP/JPY hourly chart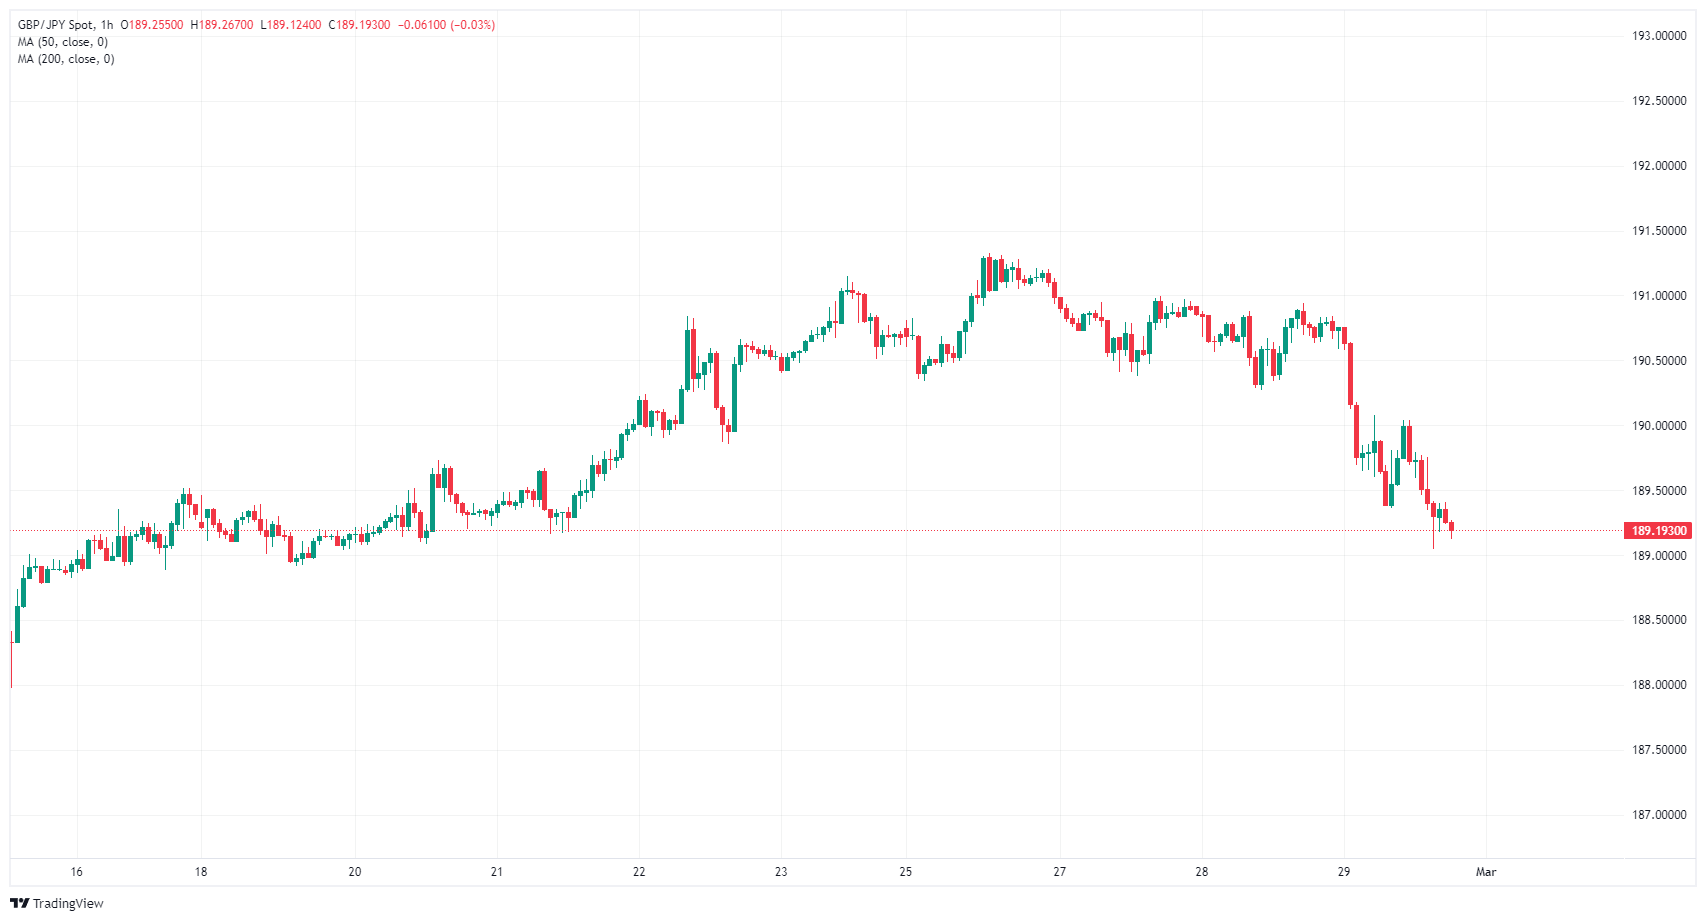
GBP/JPY daily chart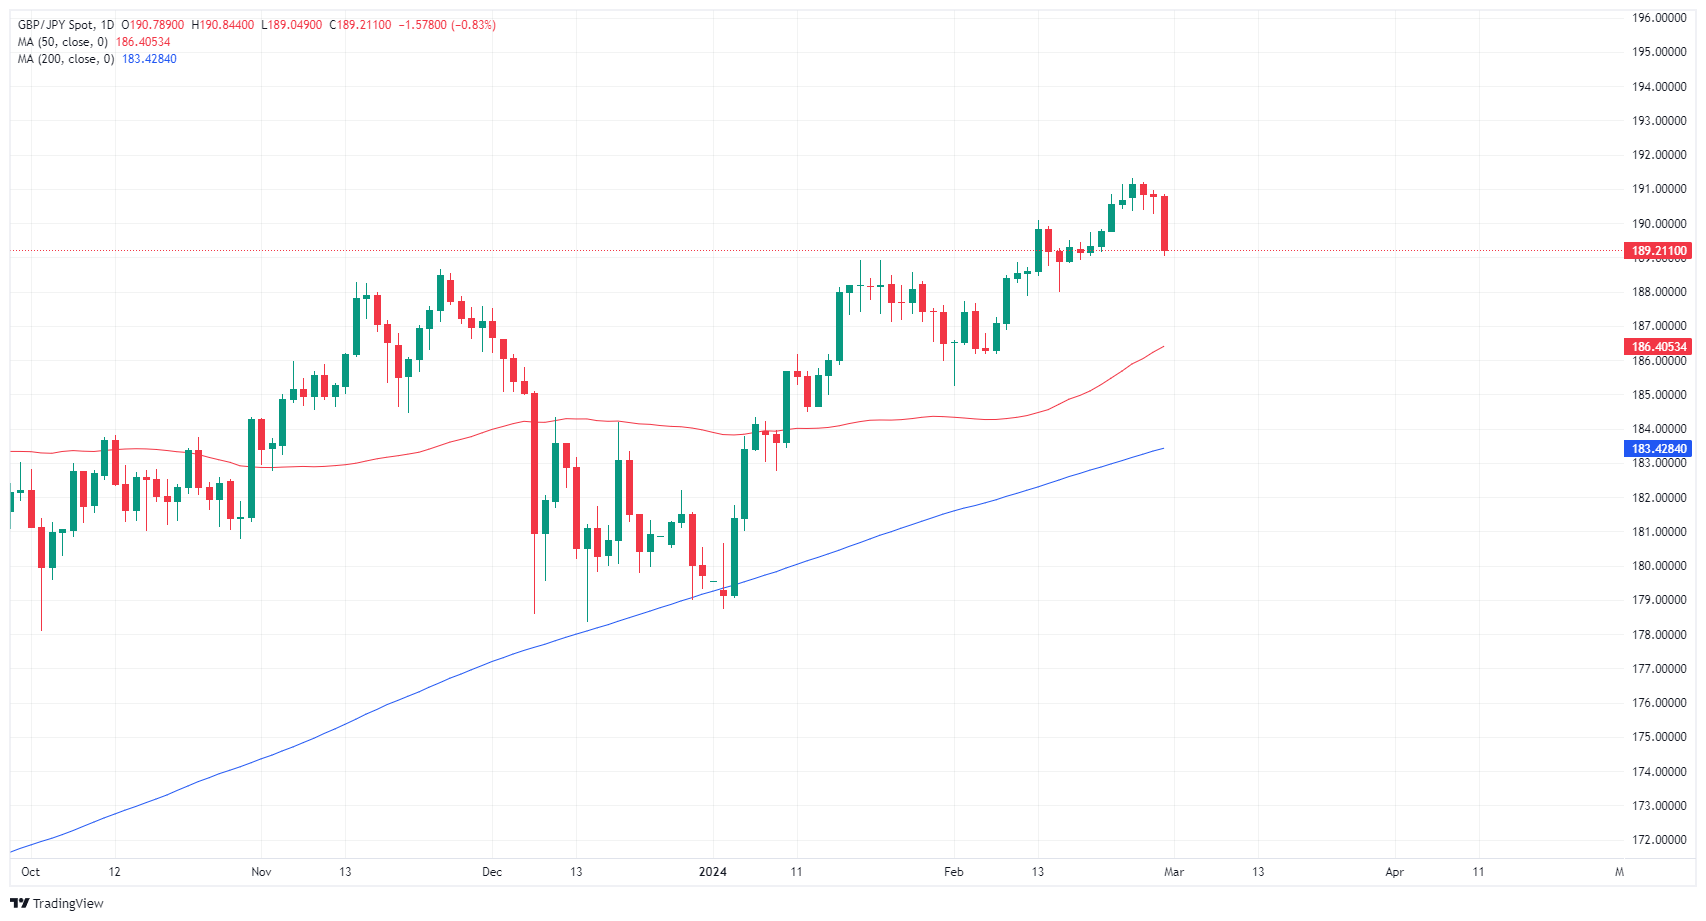
Information on these pages contains forward-looking statements that involve risks and uncertainties. Markets and instruments profiled on this page are for informational purposes only and should not in any way come across as a recommendation to buy or sell in these assets. You should do your own thorough research before making any investment decisions. FXStreet does not in any way guarantee that this information is free from mistakes, errors, or material misstatements. It also does not guarantee that this information is of a timely nature. Investing in Open Markets involves a great deal of risk, including the loss of all or a portion of your investment, as well as emotional distress. All risks, losses and costs associated with investing, including total loss of principal, are your responsibility. The views and opinions expressed in this article are those of the authors and do not necessarily reflect the official policy or position of FXStreet nor its advertisers. The author will not be held responsible for information that is found at the end of links posted on this page.
If not otherwise explicitly mentioned in the body of the article, at the time of writing, the author has no position in any stock mentioned in this article and no business relationship with any company mentioned. The author has not received compensation for writing this article, other than from FXStreet.
FXStreet and the author do not provide personalized recommendations. The author makes no representations as to the accuracy, completeness, or suitability of this information. FXStreet and the author will not be liable for any errors, omissions or any losses, injuries or damages arising from this information and its display or use. Errors and omissions excepted.
The author and FXStreet are not registered investment advisors and nothing in this article is intended to be investment advice.


Recommended content
Editors’ Picks

AUD/USD holds the bounce near 0.6400 amid signs of easing US-China trade tensions
AUD/USD attracts some dip-buyers to hold near 0.6400 in the Asian session on Wednesday. Hopes for a possible de-escalation in the US-China trade war boost investors' appetite for riskier assets and support the Aussie. Further, the pause in the US Dollar rebound also aids the pair's upside.

USD/JPY regains 142.00 as US Dollar finds its feet
USD/JPY has picked up fresh bids to regain 142.00, reversing the dip to near 141.50 in the Asian session on Wednesday. Signs of easing US-China trade tensions led to a sharp recovery in the risk sentiment, lifting the US Dollar broadly despite doubts over Trump's veracity.

Gold price is down but not out ahead of US PMI data
Gold price is heading back toward $3,400, stalling Tuesday's correction from the $3,500 mark, The US Dollar recovery fixxles, allowing Gold price to regain footing as investors remain wary about US President Trump's intentions. Trump said on Tuesday that he hopes for US-China trade war de-escalation and doesnt intend to fire Fed's Powell.

Why is the crypto market up today?
Bitcoin rallied above $93,000 on Tuesday alongside the broader financial market following Treasury Secretary Scott Bessent's statement at a closed-door meeting that the trade feud between the US and China is unsustainable.

Five fundamentals for the week: Traders confront the trade war, important surveys, key Fed speech Premium
Will the US strike a trade deal with Japan? That would be positive progress. However, recent developments are not that positive, and there's only one certainty: headlines will dominate markets. Fresh US economic data is also of interest.

The Best brokers to trade EUR/USD
SPONSORED Discover the top brokers for trading EUR/USD in 2025. Our list features brokers with competitive spreads, fast execution, and powerful platforms. Whether you're a beginner or an expert, find the right partner to navigate the dynamic Forex market.