|

GBP/JPY Price Prediction: Short-term trend may have reversed after Halloween sell-off

  • GBP/JPY may have reversed trend following the steep decline on October 31. 
  • More downside will likely find support at major moving averages, momentum is bearish. 

GBP/JPY rose up after breaking out of the Right-Angle Triangle it formed during October and reached the minimum price expectation for price pattern, at 199.59, the 61.8% Fibonacci extension of the height of the Triangle at its widest point, higher (blue-shaded rectangle). 

GBP/JPY 4-hour Chart 

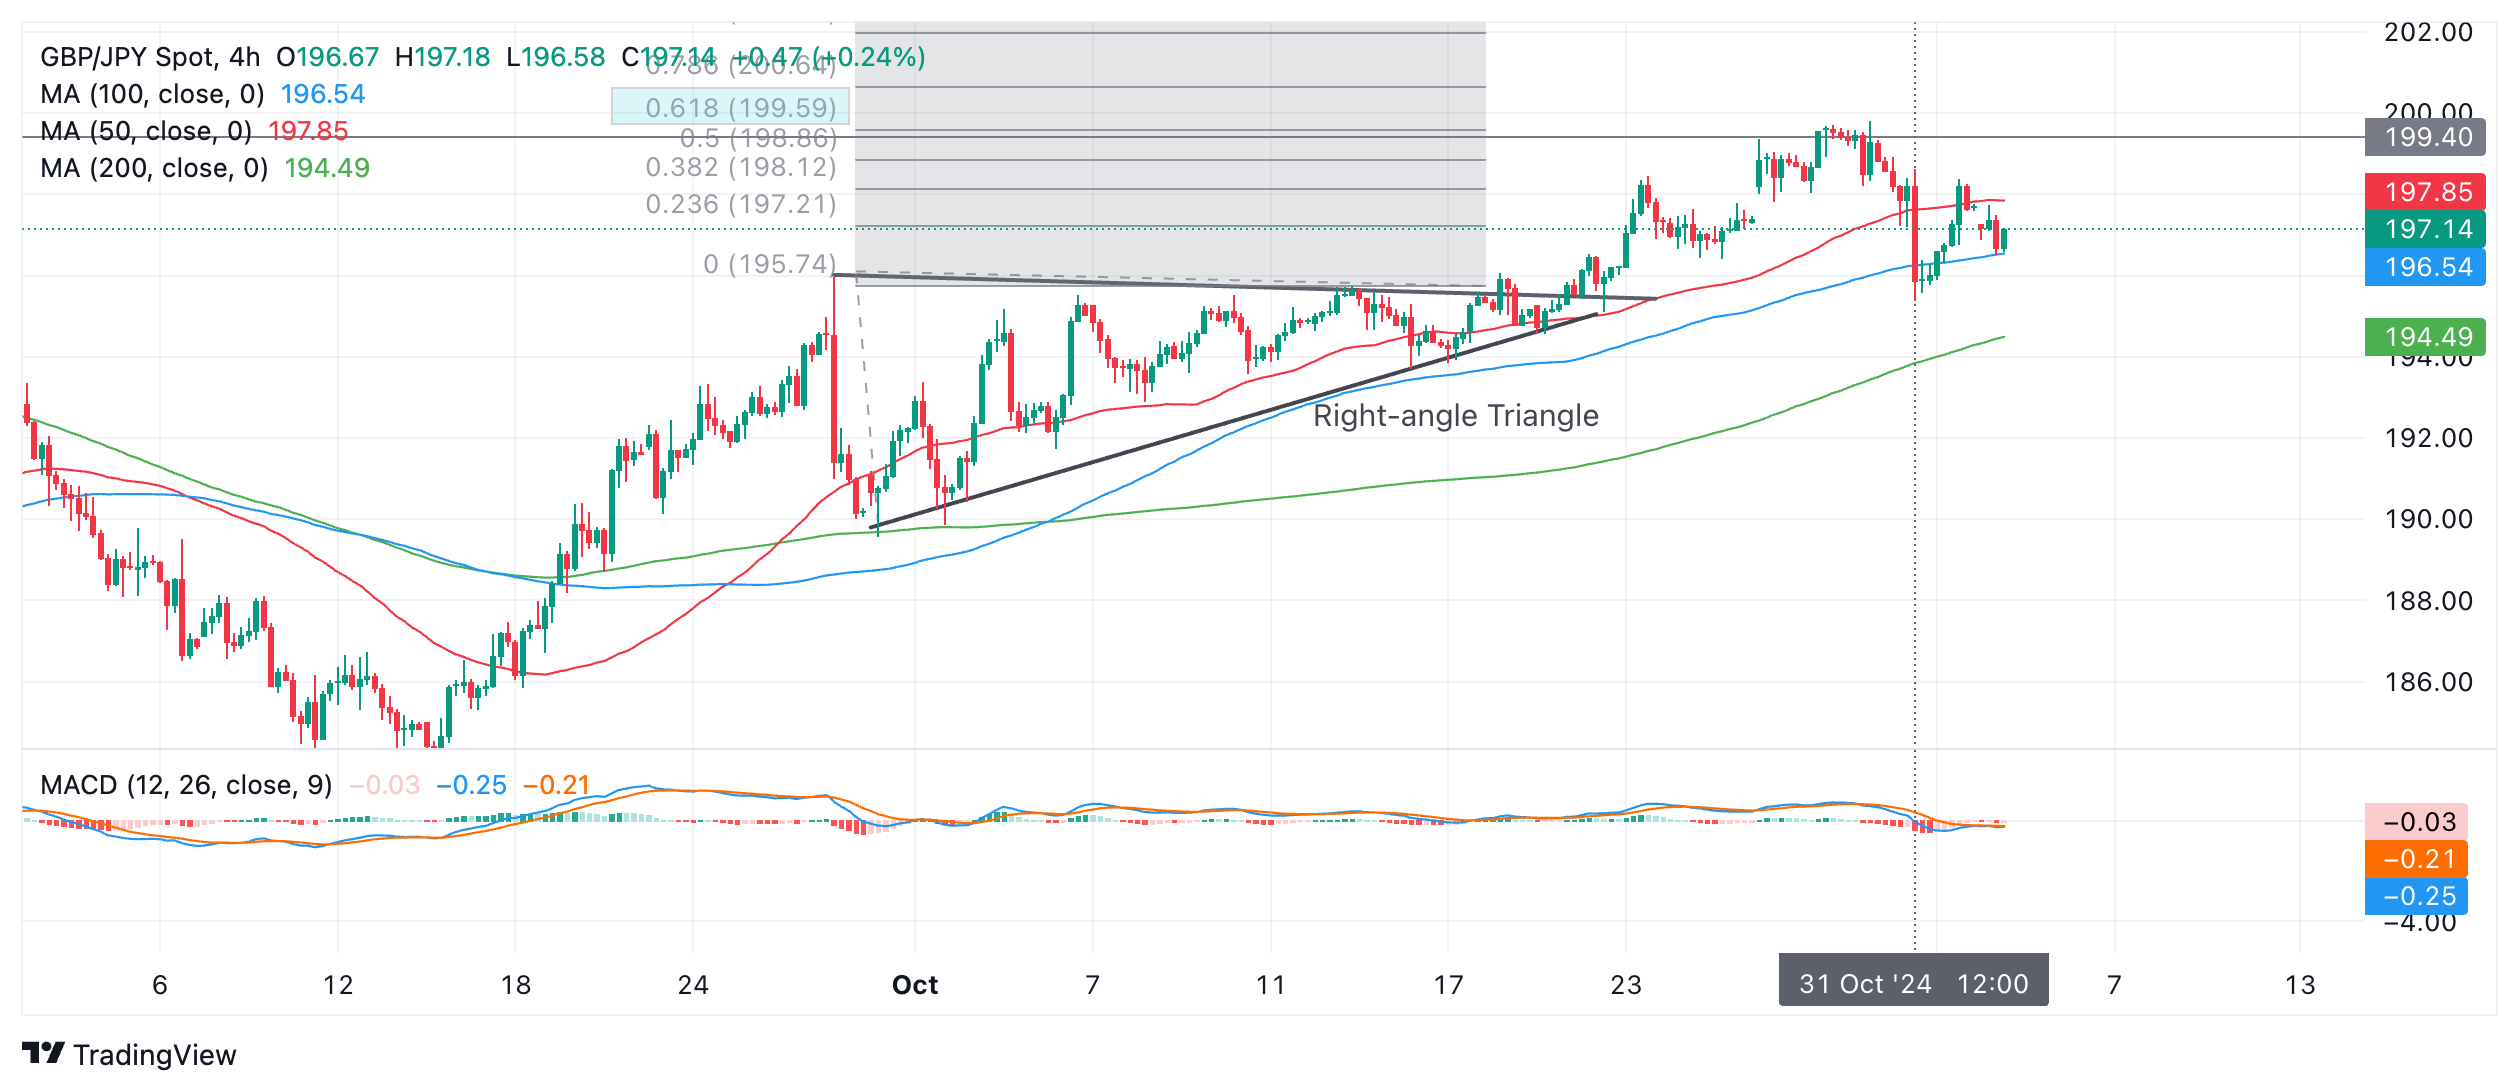
GBP/JPY was in an established short and medium term uptrend as it rose following the break out, however, since the sell-off of October 31, the short-term trend might have reversed. If the short-term trend has changed, it will suggest the bias is to the downside given the technical analysis dictum that “the trend is your friend”. Indeed it is possible the trend may have already reversed and prices could be biased to going lower. If so, now would be the ideal time to enter a low risk short position.  

A break below 195.37 would supply added confirmation and likely see a sell-off down to a target at 194.11 and the 200-day Simple Moving Average (SMA) (not shown) followed by 192.64 and the 50-day SMA (also not shown). These heavy-duty SMAs, however, are likely to provide support to falling prices. 

The blue Moving Average Convergence Divergence (MACD) momentum indicator line has crossed below the red signal line and also below the zero level, and taken together these are  bearish signs.  

Author

Joaquin Monfort

Joaquin Monfort is a financial writer and analyst with over 10 years experience writing about financial markets and alt data. He holds a degree in Anthropology from London University and a Diploma in Technical analysis.

More from Joaquin Monfort
Share:

Editor's Picks

EUR/USD looks to regain the 200-day SMA

EUR/USD regains some balance and trade just above 1.1600 the figure ahead of the opening bell in Asia. The pair initially dipped to the 1.1530 zone for the first time since November, always following the stronger US Dollar and the marked flight-to-safety in the context of the ongoing Middle East crisis
 

GBP/USD attacks 1.3300, refreshing three-month lows

GBP/USD is deep in the red near 1.3300, accelerating its downside to renew three-month lows in European trading on Tuesday. The ongoing escalation in the Iran war, combined with rising Oil prices, weighs negatively on the higher-yielding Pound Sterling as the US Dollar capitalizes on increased haven demand.

Gold bounces off lows, back above $5,100

Gold remains on the defensive, eroding part of the recent multi-day advance and managing to trade back above the $5,100 mark per troy ounce on Tuesday. The precious metal initially dropped just below the critical $5,000 threshold on the back of the persistent strength of the Greenback, higher US Treasury yields across the curve and investors' repricing of Fed rate cuts.

XRP risks extending losses as US-Iran war rages on

Ripple (XRP) has come under pressure, drifting lower to $1.35 at the time of writing on Tuesday. The over 2% correction looks poised to erase the previous day’s gains, which lifted the remittance token to $1.42.

Energy shock 2.0: Why rising Gas prices could hit the Euro

Even without a confirmed, sustained disruption, the mere risk to a key global energy chokepoint is enough to inject a significant premium into European Gas markets. And for the Euro, that matters.

Ripple falters amid sell-off jitters and negative funding rates

Ripple (XRP) has come under pressure, drifting lower to $1.35 at the time of writing on Tuesday. The over 2% correction looks poised to erase the previous day’s gains, which lifted the remittance token to $1.42.