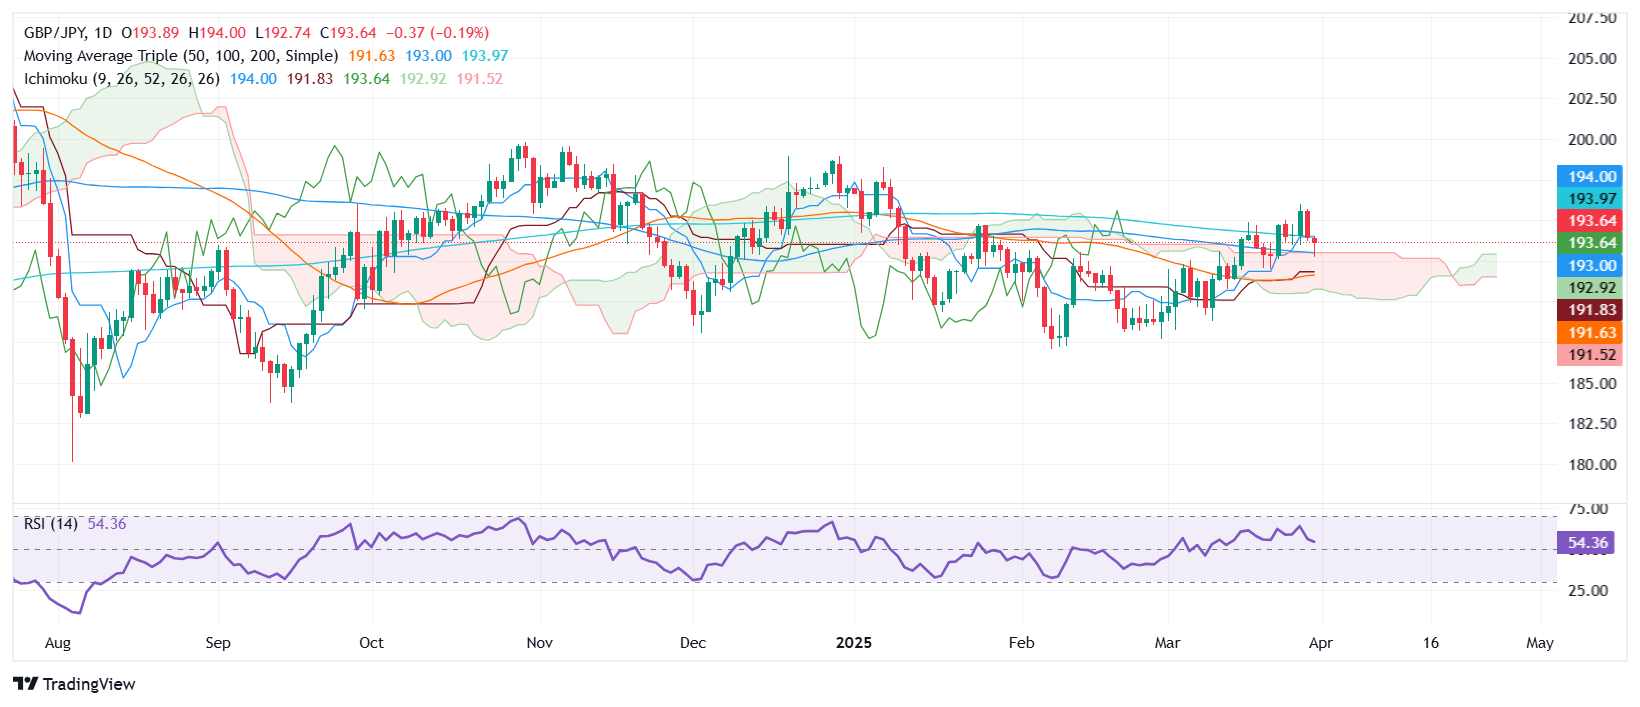
- GBP/JPY consolidates in tight 192.70–193.98 range, hovering just below 200-day SMA at 193.91.
- Bullish bias intact above Kumo, but buyers must clear 194.00 and 195.71 to resume upward trajectory.
- A drop below 192.89/193.00 could expose 191.81 Kijun-sen and 50-day SMA at 191.63.
The GBP/JPY begins Tuesday’s Asian session mostly unchanged, trading at 193.63, below the 200-day Simple Moving Average (SMA) at 193.91, as it consolidates on top and below of the latter. The cross pair remains steady within the 192.70 – 193.98 range, with buyers unable to extend its gains.
GBP/JPY Price Forecast: Technical outlook
The GBP/JPY is neutral to upward biased, with buyers' lack of strength to push prices above the 200-day SMA, so they would shift the bias to bullish. Even though price action is above the Ichimoku Cloud (Kumo), bulls must clear 194.00 alongside the March 28 peak of 195.71, so the uptrend could resume.
Key resistance levels lie above the latter, like 196.00 and the January 7 daily high of 198.24. On the flip side, if GBP/JPY tumbles below the confluence of the top of the Kumo and the 100-day SMA around 192.89/193.00, this could exacerbate a retest of 191.81, where the Kijun-sen lies, followed by the 50-day SMA at 191.63.
GBP/JPY Price Chart – Daily
British Pound PRICE This week
The table below shows the percentage change of British Pound (GBP) against listed major currencies this week. British Pound was the strongest against the New Zealand Dollar.
USD | EUR | GBP | JPY | CAD | AUD | NZD | CHF | |
---|---|---|---|---|---|---|---|---|
USD | -0.07% | -0.02% | -0.06% | 0.01% | 0.03% | 0.08% | -0.03% | |
EUR | 0.07% | -0.00% | 0.00% | 0.04% | 0.05% | 0.08% | -0.01% | |
GBP | 0.02% | 0.00% | -0.04% | 0.03% | 0.04% | 0.08% | -0.01% | |
JPY | 0.06% | 0.00% | 0.04% | 0.08% | 0.08% | 0.10% | 0.03% | |
CAD | -0.01% | -0.04% | -0.03% | -0.08% | 0.00% | 0.05% | -0.05% | |
AUD | -0.03% | -0.05% | -0.04% | -0.08% | -0.01% | 0.03% | -0.06% | |
NZD | -0.08% | -0.08% | -0.08% | -0.10% | -0.05% | -0.03% | -0.09% | |
CHF | 0.03% | 0.00% | 0.01% | -0.03% | 0.05% | 0.06% | 0.09% |
The heat map shows percentage changes of major currencies against each other. The base currency is picked from the left column, while the quote currency is picked from the top row. For example, if you pick the British Pound from the left column and move along the horizontal line to the US Dollar, the percentage change displayed in the box will represent GBP (base)/USD (quote).
Information on these pages contains forward-looking statements that involve risks and uncertainties. Markets and instruments profiled on this page are for informational purposes only and should not in any way come across as a recommendation to buy or sell in these assets. You should do your own thorough research before making any investment decisions. FXStreet does not in any way guarantee that this information is free from mistakes, errors, or material misstatements. It also does not guarantee that this information is of a timely nature. Investing in Open Markets involves a great deal of risk, including the loss of all or a portion of your investment, as well as emotional distress. All risks, losses and costs associated with investing, including total loss of principal, are your responsibility. The views and opinions expressed in this article are those of the authors and do not necessarily reflect the official policy or position of FXStreet nor its advertisers. The author will not be held responsible for information that is found at the end of links posted on this page.
If not otherwise explicitly mentioned in the body of the article, at the time of writing, the author has no position in any stock mentioned in this article and no business relationship with any company mentioned. The author has not received compensation for writing this article, other than from FXStreet.
FXStreet and the author do not provide personalized recommendations. The author makes no representations as to the accuracy, completeness, or suitability of this information. FXStreet and the author will not be liable for any errors, omissions or any losses, injuries or damages arising from this information and its display or use. Errors and omissions excepted.
The author and FXStreet are not registered investment advisors and nothing in this article is intended to be investment advice.
Recommended content
Editors’ Picks

AUD/USD climbs above 0.6200 amid broad USD weakness and trade jitters
The Australian Dollar extended its advance on Thursday, climbing toward the 0.6240 zone. The pair built on recent strength as the US Dollar Index slid further toward multi-month lows near the 101 area. This move came after markets digested the White House’s confirmation of a steep 145% tariff on Chinese goods, combined with a cautious Federal Reserve tone.

EUR/USD surges higher as tariff walk-back eases tensions further
EUR/USD roared into its highest bids in nearly two years on Thursday, breaching and closing above the 1.1200 handle for the first time in 21 months. Market tensions continue to ease following the Trump administration’s last-minute pivot away from its own tariffs, sparking a softening in US Dollar flows.

Gold rises to record high near $3,200 on US-China tariff war
Gold price surges to near an all-time high around $3,190 during the early Asian session on Friday. The weakening of the US Dollar and escalating trade war between the United States and China provide some support to the precious metal.

Bitcoin miners scurry to import mining equipment following Trump's China tariffs
Bitcoin miners are reportedly scrambling to import mining equipment into the United States following rising tariff tensions in the US-China trade war, according to a Blockspace report on Wednesday.

Trump’s tariff pause sparks rally – What comes next?
Markets staged a dramatic reversal Wednesday, led by a 12% surge in the Nasdaq and strong gains across major indices, following President Trump’s unexpected decision to pause tariff escalation for non-retaliating trade partners.

The Best brokers to trade EUR/USD
SPONSORED Discover the top brokers for trading EUR/USD in 2025. Our list features brokers with competitive spreads, fast execution, and powerful platforms. Whether you're a beginner or an expert, find the right partner to navigate the dynamic Forex market.