|

GBP/JPY Price Forecast: Right-angle Triangle poised to breakout higher

  • GBP/JPY has formed a right-angle triangle which indicates a likely breakout higher. 
  • The MACD momentum indicator is diverging bearishly with price, however, suggesting a mild downside risk.  

GBP/JPY has formed a right-angle triangle which indicates a breakout higher is likely. 

Price is more likely to break above the flat edge, according to technical analysis (TA) theory, which in this case runs along the topside of the pattern. 

GBP/JPY 4-hour Chart 

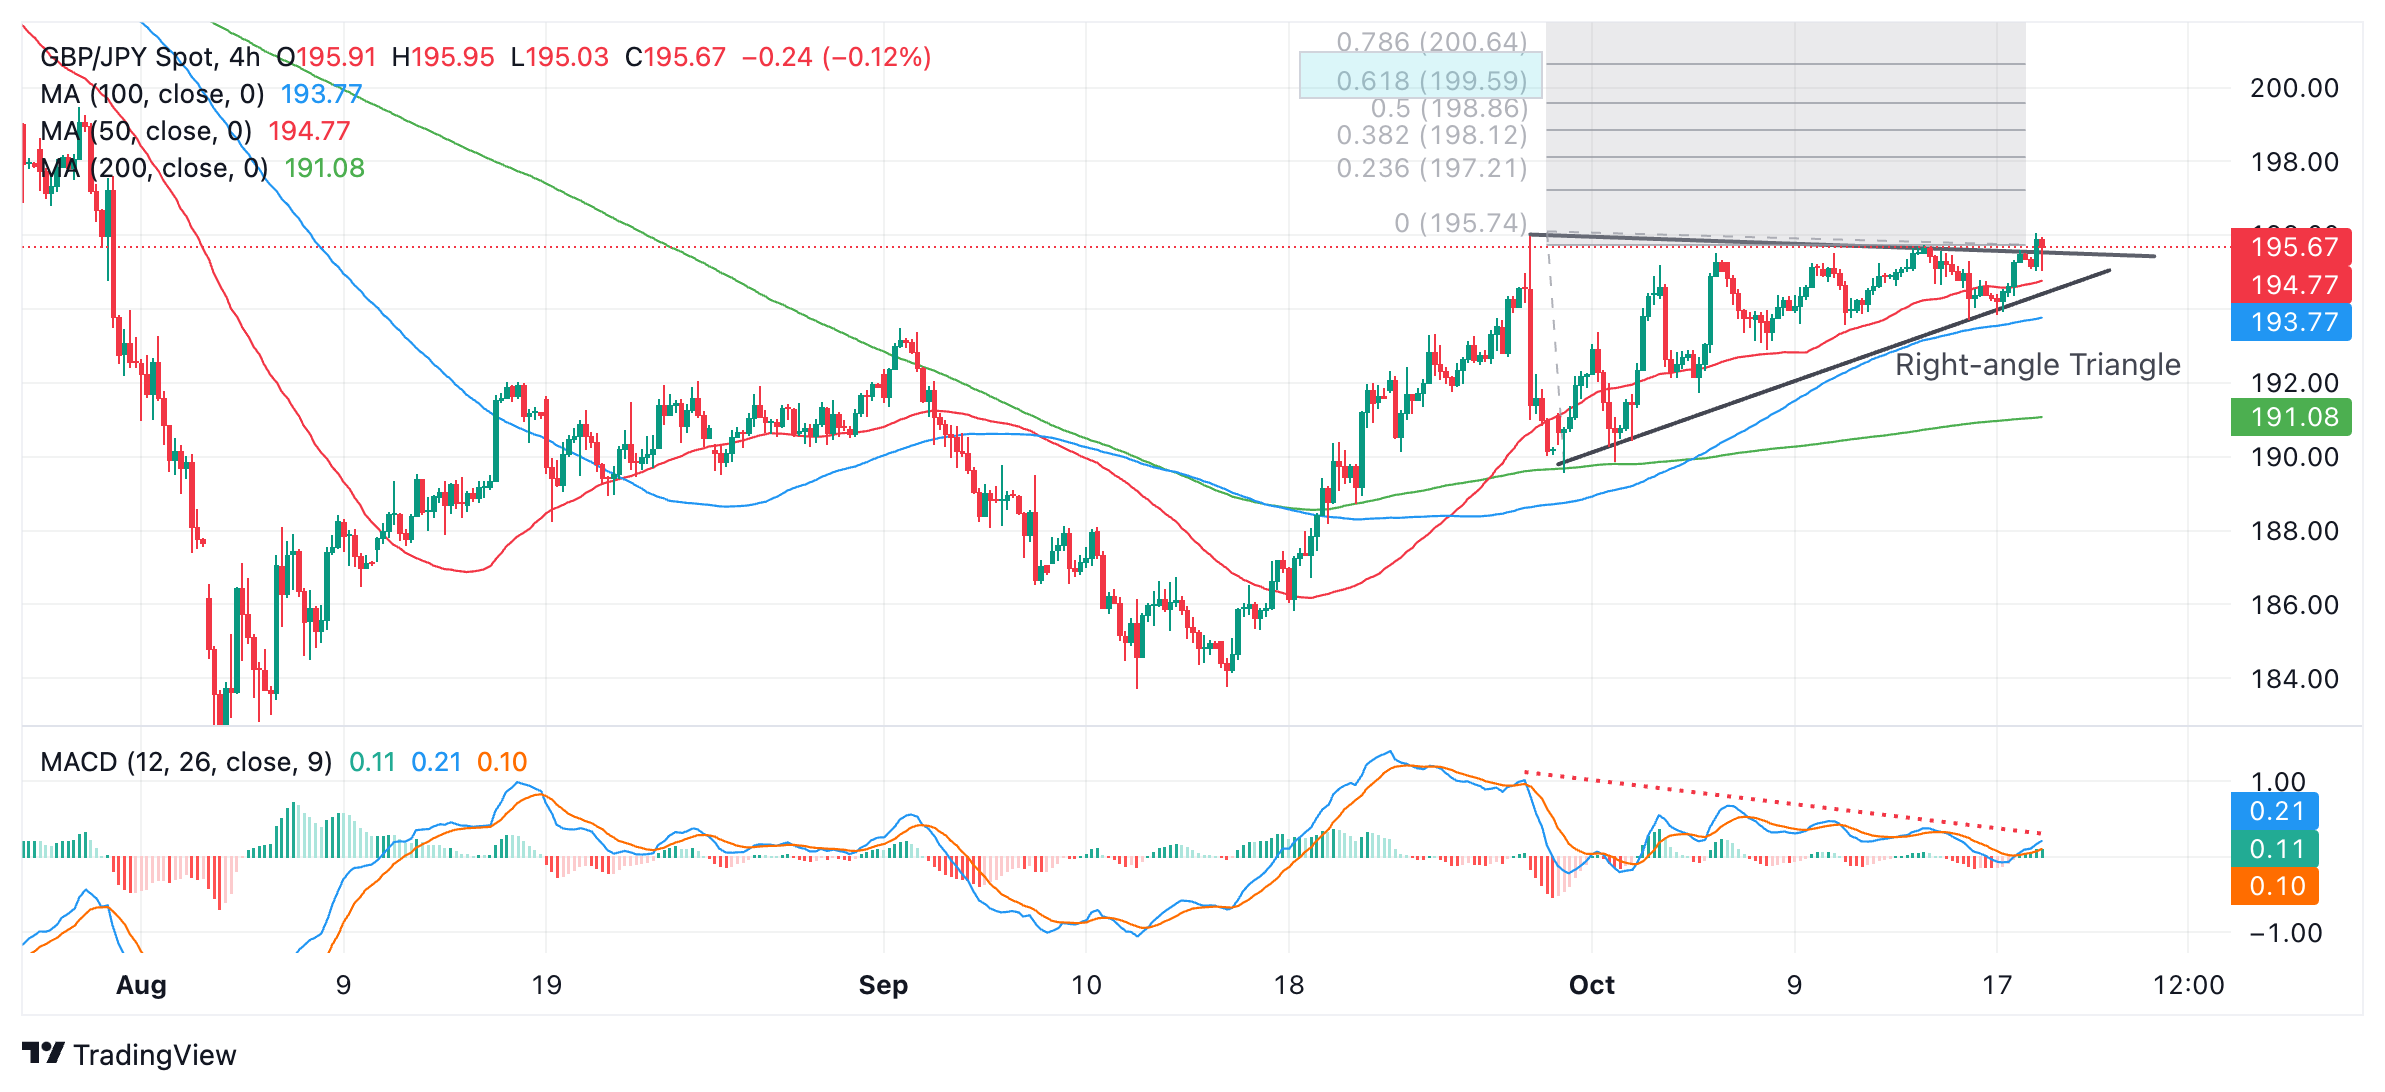
A decisive breakout above the top of the triangle would activate the pattern’s first upside target at 199.59, the 61.8% Fibonacci extrapolation of the height of the triangle (at its widest point) higher. This is the usual TA method for forecasting such moves. 

One bearish sign is that the Moving Average Divergence Convergence (MACD) momentum indicator has been diverging bearishly with price during the formation of the triangle. Whilst price has made a higher high, MACD has declined. This is a mildly bearish sign. 

A decisive breakout would be one accompanied by a long green candlestick that pierced cleanly through the top of the triangle at 196.00 and closed above near its high. This, or three green candlesticks in a row that broke cleanly above the flat top of the pattern. 

Author

Joaquin Monfort

Joaquin Monfort is a financial writer and analyst with over 10 years experience writing about financial markets and alt data. He holds a degree in Anthropology from London University and a Diploma in Technical analysis.

More from Joaquin Monfort
Share:

Editor's Picks

EUR/USD remains below 1.1850 after US data

EUR/USD struggles to gain traction and trades in a narrow range below 1.1850 on Wednesday. The US Dollar stays resilient against its rivals following the better-than-expected Durable Goods Orders and housing data, limiting the pair's upside ahead of FOMC Minutes. 

GBP/USD stays in narrow channel above 1.3550 ahead of FOMC Minutes

GBP/USD holds its ground following Tuesday's slide and moves sideways above 1.3550 midweek. Although the data from the UK confirmed that inflation cooled in January, the positive shift seen in market mood helps the pair keep its footing as investors wait for the Fed to publish the minnutes of the January policy meeting.

Gold regains some shine, retargets $5,000 ahead of FOMC Minutes

Gold gathers fresh upside traction on Wednesday, leaving part of the weakness seen at the beginning of the week and refocusing its attention to the key $5,000 mark per troy ounce, all ahead of the release of the FOMC Minutes and despite the modest uptick in the US Dollar.

Pi Network rally defies market pressure ahead of its first anniversary

Pi Network is trading above $0.1900 at press time on Wednesday, extending the weekly gains by nearly 8% so far. The steady recovery is supported by a short-term pause in mainnet migration, which reduces pressure on the PI token supply for Centralized Exchanges. The technical outlook focuses on the $0.1919 resistance as bullish momentum increases.

Mixed UK inflation data no gamechanger for the Bank of England

Food inflation plunged in January, but service sector price pressure is proving stickier. We continue to expect Bank of England rate cuts in March and June. The latest UK inflation read is a mixed bag for the Bank of England, but we doubt it drastically changes the odds of a March rate cut.

Top 3 Price Prediction: Bitcoin, Ethereum, and Ripple face downside risk as bears regain control

Bitcoin, Ethereum, and Ripple remain under pressure on Wednesday, with the broader trend still sideways. BTC is edging below $68,000, nearing the lower consolidating boundary, while ETH and XRP also declined slightly, approaching their key supports.