- GBP/JPY falls to 193.28, ending three-day rally after failing to surpass 195.00 and 200-day SMA at 194.18.
- Trading sideways; support at 193.23 (100-day SMA) and 192.28 (Senkou Span B) maintains range-bound status.
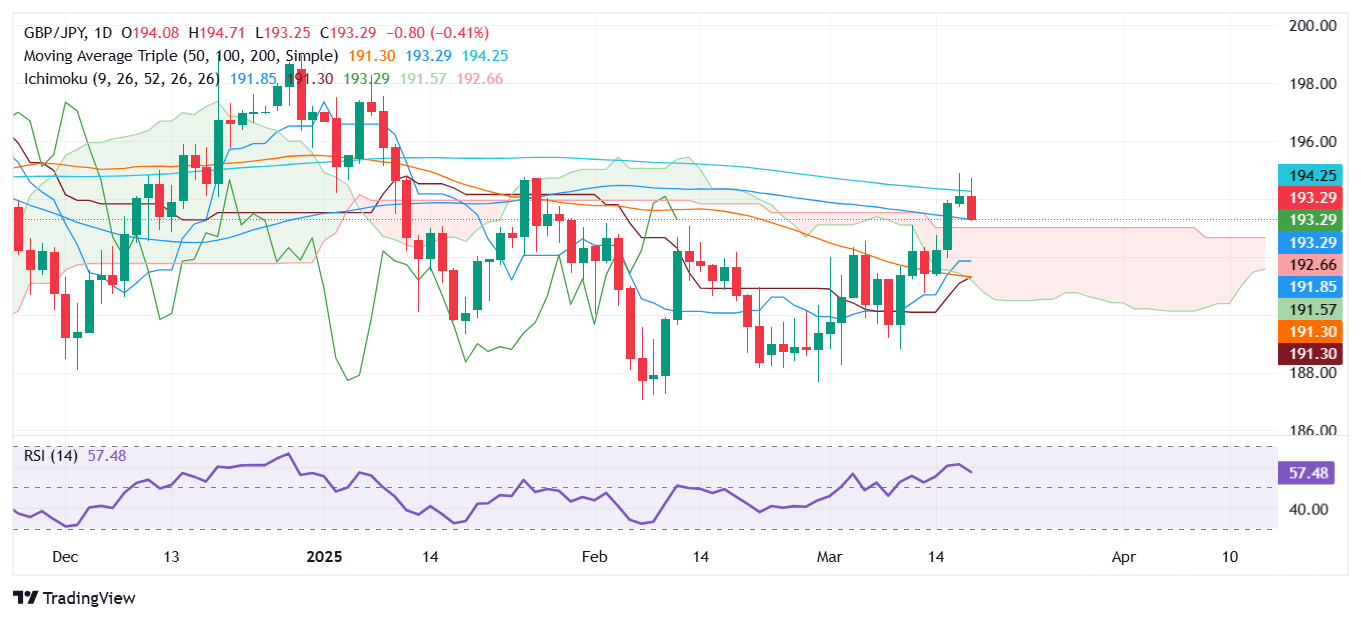
- Break below 192.28 could target 191.83 (Tenkan-sen); push above 194.89 may challenge 195.00 resistance.
The GBP/JPY retreats after rallying for three straight trading days since last Friday. However, it struggled to clear the 195.00 figure and the 200-day Simple Moving Average (SMA), which exacerbated a drop in the cross pair beneath the 193.50 area. At the time of writing, the pair hovers near 193.28, virtually unchanged.
GBP/JPY Price Forecast: Technical outlook
The GBP/JPY trades sideways for the second straight day, capped on the downside by the 100-day Simple Moving Average (SMA) at 193.23 and the Senkou Span B near 192.28. On the top side, the 200-day SMA at 194.18 would likely keep the pair trading range bound.
Additionally, despite being bullish, the Relative Strength Index (RSI) is flat. Hence, buyers and sellers lack the strength to break the trading range.
If GBP/JPY falls below 192.28, the next support would be the Tenkan-sen at 191.83, followed by the Kijun-sen at 191.24. Conversely, if GBP/JPY climbs past the 200-day SMA, the next resistance would be the March 18 peak at 194.89, ahead of 195.00.
GBP/JPY Price Chart – Daily
British Pound PRICE This week
The table below shows the percentage change of British Pound (GBP) against listed major currencies this week. British Pound was the strongest against the US Dollar.
| USD | EUR | GBP | JPY | CAD | AUD | NZD | CHF | |
|---|---|---|---|---|---|---|---|---|
| USD | -0.28% | -0.54% | -0.10% | -0.44% | -0.46% | -1.27% | -0.94% | |
| EUR | 0.28% | -0.38% | -0.21% | -0.15% | -0.31% | -1.00% | -0.68% | |
| GBP | 0.54% | 0.38% | 0.48% | 0.02% | 0.05% | -0.63% | -0.37% | |
| JPY | 0.10% | 0.21% | -0.48% | -0.34% | -0.56% | -1.12% | -0.96% | |
| CAD | 0.44% | 0.15% | -0.02% | 0.34% | -0.20% | -0.82% | -1.05% | |
| AUD | 0.46% | 0.31% | -0.05% | 0.56% | 0.20% | -0.67% | -0.35% | |
| NZD | 1.27% | 1.00% | 0.63% | 1.12% | 0.82% | 0.67% | 0.32% | |
| CHF | 0.94% | 0.68% | 0.37% | 0.96% | 1.05% | 0.35% | -0.32% |
The heat map shows percentage changes of major currencies against each other. The base currency is picked from the left column, while the quote currency is picked from the top row. For example, if you pick the British Pound from the left column and move along the horizontal line to the US Dollar, the percentage change displayed in the box will represent GBP (base)/USD (quote).
Information on these pages contains forward-looking statements that involve risks and uncertainties. Markets and instruments profiled on this page are for informational purposes only and should not in any way come across as a recommendation to buy or sell in these assets. You should do your own thorough research before making any investment decisions. FXStreet does not in any way guarantee that this information is free from mistakes, errors, or material misstatements. It also does not guarantee that this information is of a timely nature. Investing in Open Markets involves a great deal of risk, including the loss of all or a portion of your investment, as well as emotional distress. All risks, losses and costs associated with investing, including total loss of principal, are your responsibility. The views and opinions expressed in this article are those of the authors and do not necessarily reflect the official policy or position of FXStreet nor its advertisers. The author will not be held responsible for information that is found at the end of links posted on this page.
If not otherwise explicitly mentioned in the body of the article, at the time of writing, the author has no position in any stock mentioned in this article and no business relationship with any company mentioned. The author has not received compensation for writing this article, other than from FXStreet.
FXStreet and the author do not provide personalized recommendations. The author makes no representations as to the accuracy, completeness, or suitability of this information. FXStreet and the author will not be liable for any errors, omissions or any losses, injuries or damages arising from this information and its display or use. Errors and omissions excepted.
The author and FXStreet are not registered investment advisors and nothing in this article is intended to be investment advice.


Recommended content
Editors’ Picks

EUR/USD extends gains toward 1.1400 after German sentiment data
EUR/USD stretches higher toward 1.1400 in the European session after upbeat German business sentiment data. The pair's solid uptick could also be linked to the latest leg down in the US Dollar as concerns re-emerge over Trump's tariff plans with China and Japan.

GBP/USD holds firm near 1.3300 on intense US Dollar weakness
GBP/USD rises further to test 1.3400 in European trading on Thursday, snapping a two-day losing streak. Uncertainty over US President Donald Trump's tariff plans returns and sends the US Dollar sharply lower across the board, suporting the pair. Mid-tier US data awaited.

Gold price pushes back at selling pressure with Trump putting reciprocal tariffs back on the table
Gold price recovers from a two-day decline and traders around $3,335 now on Thursday after two days of firm selling pressure since it topped at $3,500 on Tuesday. President Trump released more comments from the Oval Office late Wednesday signaling that China may receive a new tariff rate in the next “two to three weeks”

Bitcoin Price corrects as increased profit-taking offsets positive market sentiment
Bitcoin (BTC) is facing a slight correction, trading around $92,000 at the time of writing on Thursday after rallying 8.55% so far this week. Institutional demand remained strong as US spot Exchange Traded Funds (ETFs) recorded an inflow of $916.91 million on Wednesday.

Five fundamentals for the week: Traders confront the trade war, important surveys, key Fed speech Premium
Will the US strike a trade deal with Japan? That would be positive progress. However, recent developments are not that positive, and there's only one certainty: headlines will dominate markets. Fresh US economic data is also of interest.

The Best brokers to trade EUR/USD
SPONSORED Discover the top brokers for trading EUR/USD in 2025. Our list features brokers with competitive spreads, fast execution, and powerful platforms. Whether you're a beginner or an expert, find the right partner to navigate the dynamic Forex market.