- GBP/JPY rises over 0.20%, showing resilience ahead of key UK economic releases.
- Technical indicators suggest bullish momentum, with the pair navigating inside the Ichimoku Cloud.
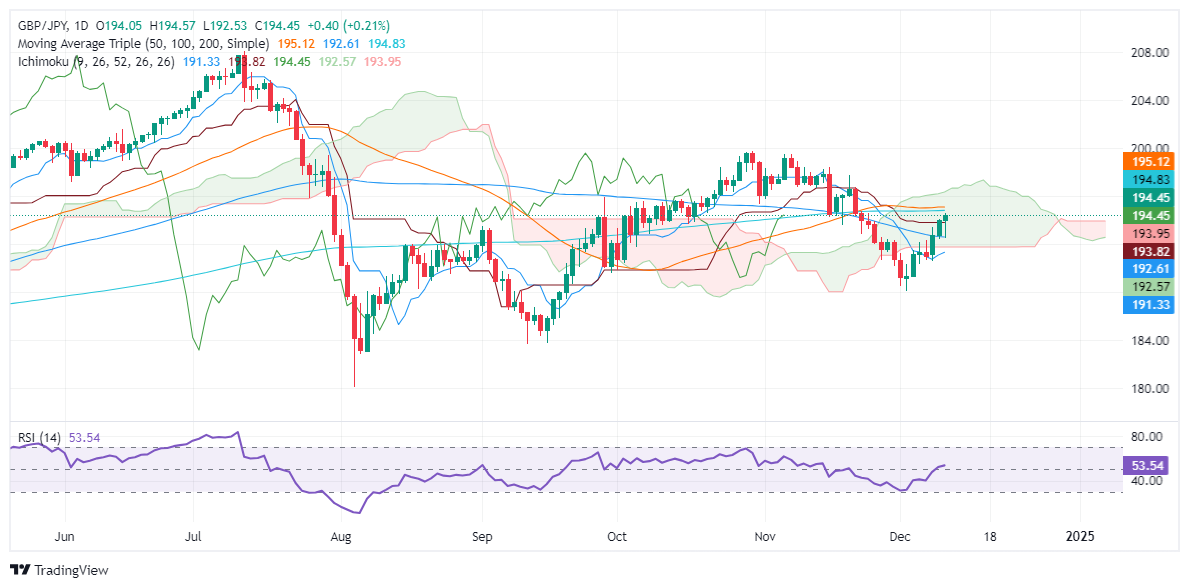
- Key resistance at 200-day SMA of 194.74; support levels to watch include 193.95 and 100-day SMA at 192.53.
The Pound Sterling registered decent gains of over 0.20% against the Japanese Yen in early trading during Wednesday's North American session despite the lack of a catalyst boosting the former. The GBP/JPY trades at 194.46 after bouncing off daily lows of 192.49.
Price action remains slightly muted. Traders are awaiting the release of Gross Domestic Product (GDP) figures in the UK on Friday, which are expected to show an improvement in October’s figures.
GBP/JPY Price Forecast: Technical outlook
The GBP/JPY recovered after falling over 4.58% in mid-November, hitting its lowest level since September at 188.06. However, buyers lifted the exchange rate well inside the Ichimoku Cloud (Kumo), clearing key technical resistance levels like the Tenkan-Sen and the Kijun-Sen.
Momentum picked up, showing that bulls are in charge, as depicted by the Relative Strength Index (RSI), which turned bullish, with the slope aiming higher.
If GBP/JPY clears the 200-day Simple Moving Average (SMA) at 194.74, further upside is seen. The 50-day SMA is next at 195.06. A breach of the latter exposes the top of the Kumo at 196.20-40.
Conversely, if GBP/JPY tumbles below the confluence of the Kijun-Sen and the Senkou Span B at around 193.95, the next support would be the 100-day SMA at 192.53 before testing the bottom of the Kumo at 191.75-95.
GBP/JPY Price Chart – Daily
British Pound PRICE Today
The table below shows the percentage change of British Pound (GBP) against listed major currencies today. British Pound was the strongest against the Japanese Yen.
| USD | EUR | GBP | JPY | CAD | AUD | NZD | CHF | |
|---|---|---|---|---|---|---|---|---|
| USD | 0.12% | 0.22% | 0.43% | -0.00% | 0.27% | 0.28% | 0.00% | |
| EUR | -0.12% | 0.09% | 0.32% | -0.12% | 0.15% | 0.16% | -0.11% | |
| GBP | -0.22% | -0.09% | 0.19% | -0.22% | 0.06% | 0.06% | -0.21% | |
| JPY | -0.43% | -0.32% | -0.19% | -0.44% | -0.16% | -0.17% | -0.42% | |
| CAD | 0.00% | 0.12% | 0.22% | 0.44% | 0.27% | 0.28% | 0.01% | |
| AUD | -0.27% | -0.15% | -0.06% | 0.16% | -0.27% | 0.00% | -0.26% | |
| NZD | -0.28% | -0.16% | -0.06% | 0.17% | -0.28% | -0.01% | -0.27% | |
| CHF | -0.01% | 0.11% | 0.21% | 0.42% | -0.01% | 0.26% | 0.27% |
The heat map shows percentage changes of major currencies against each other. The base currency is picked from the left column, while the quote currency is picked from the top row. For example, if you pick the British Pound from the left column and move along the horizontal line to the US Dollar, the percentage change displayed in the box will represent GBP (base)/USD (quote).
Information on these pages contains forward-looking statements that involve risks and uncertainties. Markets and instruments profiled on this page are for informational purposes only and should not in any way come across as a recommendation to buy or sell in these assets. You should do your own thorough research before making any investment decisions. FXStreet does not in any way guarantee that this information is free from mistakes, errors, or material misstatements. It also does not guarantee that this information is of a timely nature. Investing in Open Markets involves a great deal of risk, including the loss of all or a portion of your investment, as well as emotional distress. All risks, losses and costs associated with investing, including total loss of principal, are your responsibility. The views and opinions expressed in this article are those of the authors and do not necessarily reflect the official policy or position of FXStreet nor its advertisers. The author will not be held responsible for information that is found at the end of links posted on this page.
If not otherwise explicitly mentioned in the body of the article, at the time of writing, the author has no position in any stock mentioned in this article and no business relationship with any company mentioned. The author has not received compensation for writing this article, other than from FXStreet.
FXStreet and the author do not provide personalized recommendations. The author makes no representations as to the accuracy, completeness, or suitability of this information. FXStreet and the author will not be liable for any errors, omissions or any losses, injuries or damages arising from this information and its display or use. Errors and omissions excepted.
The author and FXStreet are not registered investment advisors and nothing in this article is intended to be investment advice.
Recommended content
Editors’ Picks

AUD/USD holds solid-Aussie jobs data-led gains above 0.6400
AUD/USD holds sizeable gains above 0.6400 early Thursday, capitalizing on stellar Australian jobs data, which pointed to a still resilient labour market and forced investors to scale back their bets for a rate cut by the RBA in February.

USD/JPY extends losses to near 152.00 amid risk-aversion, US Dollar retreat
USD/JPY drifts lower to near 152.00 in Thursday's Asian trading, snapping a three-day winning streak to a two-week high.The pair remains weighed down by a broad US Dollar pullback, risk-aversion and uncertainty around the BoJ rate hike next week. Focus shifts to US data.

Gold price retains its bullish bias near two-week high on Fed rate cut optimism
Gold price stands firm near the $2,720-2,722 area, or over a two-week high on Thursday amid the likelihood of a Fed rate cut next week. Furthermore, geopolitical risks and trade war fears remain supportive of the bullish sentiment surrounding the safe-haven XAU/USD.

Ripple's XRP could extend its rally to $4.75 after recent consolidation, rising profit-taking poses threat
Ripple's XRP continued its rally on Wednesday as it looks to test the upper boundary of a key flag channel. Following the recent price rise, investors booked profits worth nearly $800 million while options traders bet on the remittance-based token hitting the $5 mark.

BTC faces setback from Microsoft’s rejection
Bitcoin price hovers around $98,400 on Wednesday after declining 4.47% since Monday. Microsoft shareholders rejected the proposal to add Bitcoin to the company’s balance sheet on Tuesday.

Best Forex Brokers with Low Spreads
VERIFIED Low spreads are crucial for reducing trading costs. Explore top Forex brokers offering competitive spreads and high leverage. Compare options for EUR/USD, GBP/USD, USD/JPY, and Gold.
