- GBP/JPY may depreciate further as daily chart analysis suggests a bearish bias.
- The nine-day EMA sits below the 14-day EMA, signaling continued weakness in short-term price momentum.
- The immediate support appears at the lower boundary of the descending channel at 193.50 level.
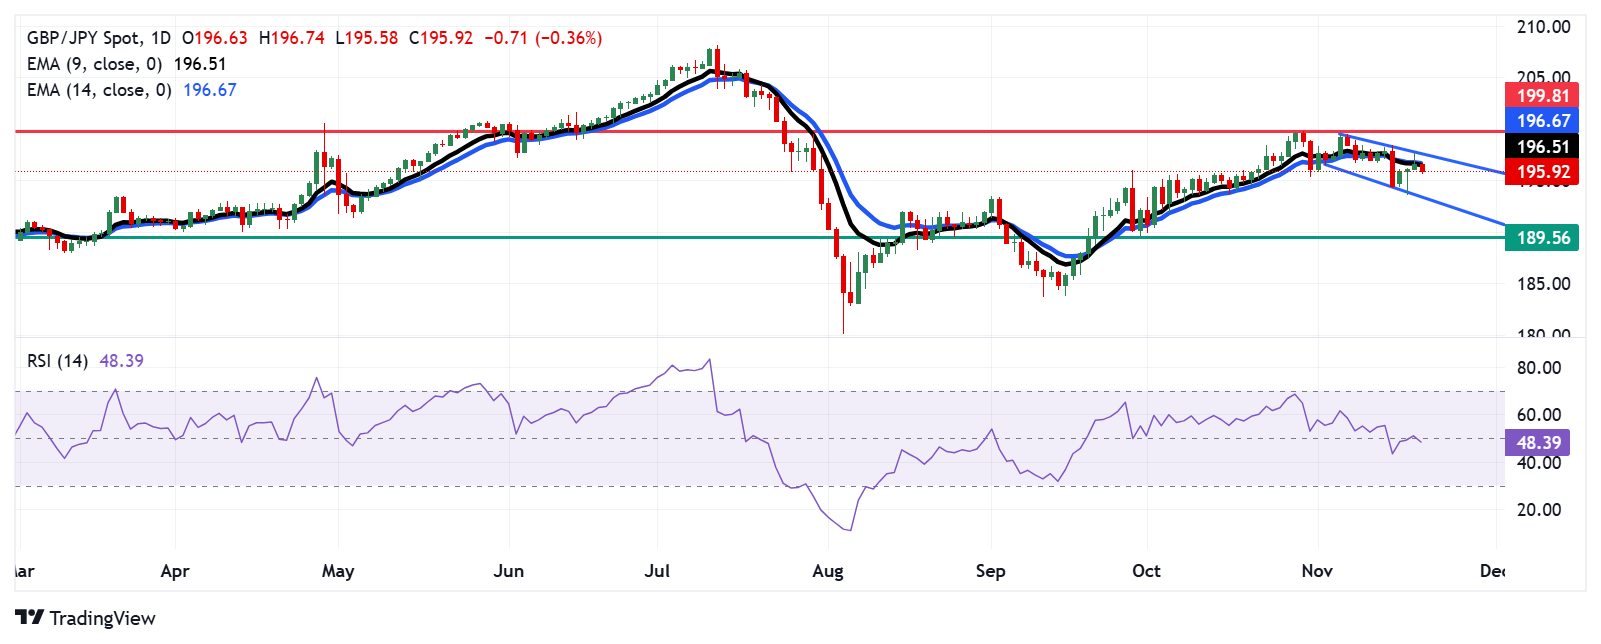
The GBP/JPY cross pares its recent gains, trading around 195.80 during the early European hours on Thursday. The daily chart analysis indicates that the pair is positioned within the descending channel pattern, suggesting a bearish bias.
The 14-day Relative Strength Index (RSI) is slightly below the 50 level, confirming bearish momentum. Additionally, the nine-day Exponential Moving Average (EMA) is positioned below the 14-day EMA, indicating persistent weakness in short-term price momentum.
On the downside, the GBP/JPY cross may navigate the region around the lower boundary of the descending channel at the 193.50 level. A break below this level would reinforce the bearish bias and put downward pressure on the currency cross to revisit the two-month low at the 189.56 level, which was recorded on September 30.
Regarding the upside, the immediate barrier appears at the nine-day EMA at 196.46 level, followed by the 14-day EMA at 196.63 level. Further resistance appears at the upper boundary of the descending channel at 197.70 level. A successful breach above this channel could cause the emergence of the bullish bias and support the GBP/JPY cross to test the four-month high at 199.81 level, reached on October 30.
GBP/JPY: Daily Chart
British Pound PRICE Today
The table below shows the percentage change of British Pound (GBP) against listed major currencies today. British Pound was the weakest against the Japanese Yen.
| USD | EUR | GBP | JPY | CAD | AUD | NZD | CHF | |
|---|---|---|---|---|---|---|---|---|
| USD | -0.07% | -0.06% | -0.48% | -0.09% | -0.21% | 0.06% | -0.21% | |
| EUR | 0.07% | 0.01% | -0.38% | -0.02% | -0.14% | 0.12% | -0.15% | |
| GBP | 0.06% | -0.01% | -0.37% | -0.04% | -0.16% | 0.11% | -0.16% | |
| JPY | 0.48% | 0.38% | 0.37% | 0.37% | 0.26% | 0.49% | 0.25% | |
| CAD | 0.09% | 0.02% | 0.04% | -0.37% | -0.11% | 0.15% | -0.12% | |
| AUD | 0.21% | 0.14% | 0.16% | -0.26% | 0.11% | 0.26% | -0.01% | |
| NZD | -0.06% | -0.12% | -0.11% | -0.49% | -0.15% | -0.26% | -0.27% | |
| CHF | 0.21% | 0.15% | 0.16% | -0.25% | 0.12% | 0.01% | 0.27% |
The heat map shows percentage changes of major currencies against each other. The base currency is picked from the left column, while the quote currency is picked from the top row. For example, if you pick the British Pound from the left column and move along the horizontal line to the US Dollar, the percentage change displayed in the box will represent GBP (base)/USD (quote).
Information on these pages contains forward-looking statements that involve risks and uncertainties. Markets and instruments profiled on this page are for informational purposes only and should not in any way come across as a recommendation to buy or sell in these assets. You should do your own thorough research before making any investment decisions. FXStreet does not in any way guarantee that this information is free from mistakes, errors, or material misstatements. It also does not guarantee that this information is of a timely nature. Investing in Open Markets involves a great deal of risk, including the loss of all or a portion of your investment, as well as emotional distress. All risks, losses and costs associated with investing, including total loss of principal, are your responsibility. The views and opinions expressed in this article are those of the authors and do not necessarily reflect the official policy or position of FXStreet nor its advertisers. The author will not be held responsible for information that is found at the end of links posted on this page.
If not otherwise explicitly mentioned in the body of the article, at the time of writing, the author has no position in any stock mentioned in this article and no business relationship with any company mentioned. The author has not received compensation for writing this article, other than from FXStreet.
FXStreet and the author do not provide personalized recommendations. The author makes no representations as to the accuracy, completeness, or suitability of this information. FXStreet and the author will not be liable for any errors, omissions or any losses, injuries or damages arising from this information and its display or use. Errors and omissions excepted.
The author and FXStreet are not registered investment advisors and nothing in this article is intended to be investment advice.


Recommended content
Editors’ Picks

EUR/USD softens to near 1.1350, overbought RSI condition eyed
The EUR/USD pair attracts some sellers to around 1.1365 during the early European session on Thursday. Traders might prefer to wait on the sidelines ahead of the European Central Bank interest rate decision later on Thursday.

Gold price remains on the defensive below all-time peak amid positive risk tone
Gold price enters a bullish consolidation phase after hitting a fresh all-time peak on Thursday. A modest USD bounce and a positive risk tone cap the commodity amid overbought conditions. US-China trade war concerns, recession fears, and Fed rate cut bets support the XAU/USD pair.

GBP/USD trades below 1.3250 after retreating from six-month highs
GBP/USD snaps its seven-day winning streak, easing to around 1.3230 during Thursday’s Asian session after retreating from a six-month high of 1.3292 reached on Wednesday. Traders now await key US data releases later in the day, including Building Permits, Housing Starts, and more.

RAY sees double-digit gains as Raydium unveils new Pumpfun competitor
RAY surged 10% on Wednesday as Raydium revealed its new meme coin launchpad, LaunchLab, a potential competitor to Pump.fun — which also recently unveiled its decentralized exchange (DEX) PumpSwap.

Future-proofing portfolios: A playbook for tariff and recession risks
It does seem like we will be talking tariffs for a while. And if tariffs stay — in some shape or form — even after negotiations, we’ll likely be talking about recession too. Higher input costs, persistent inflation, and tighter monetary policy are already weighing on global growth.

The Best brokers to trade EUR/USD
SPONSORED Discover the top brokers for trading EUR/USD in 2025. Our list features brokers with competitive spreads, fast execution, and powerful platforms. Whether you're a beginner or an expert, find the right partner to navigate the dynamic Forex market.