GBP/JPY Price Analysis: Tumbles below 164.00, approaches the H4 head-and-shoulders target


  • GBP/JPY is set to finish the week with decent losses of 1.28%.
  • From a daily chart perspective, the cross-currency GBP/JPY shifted to neutral biased.
  • Short term, the GBP/JPY is about to hit 162.30. the head-and-shoulders target.

The GBP/JPY drops for the four consecutive trading session, down by 0.86% on Friday, after Wall Street finished the last trading day with losses between 0.45% and 0.90%, spurred by a dismal sentiment. In the FX complex, safe-haven peers rose, except for the greenback, which finished unchanged. At the time of writing, the GBP/JPY is trading at 163.24, as Wall Street’s close.

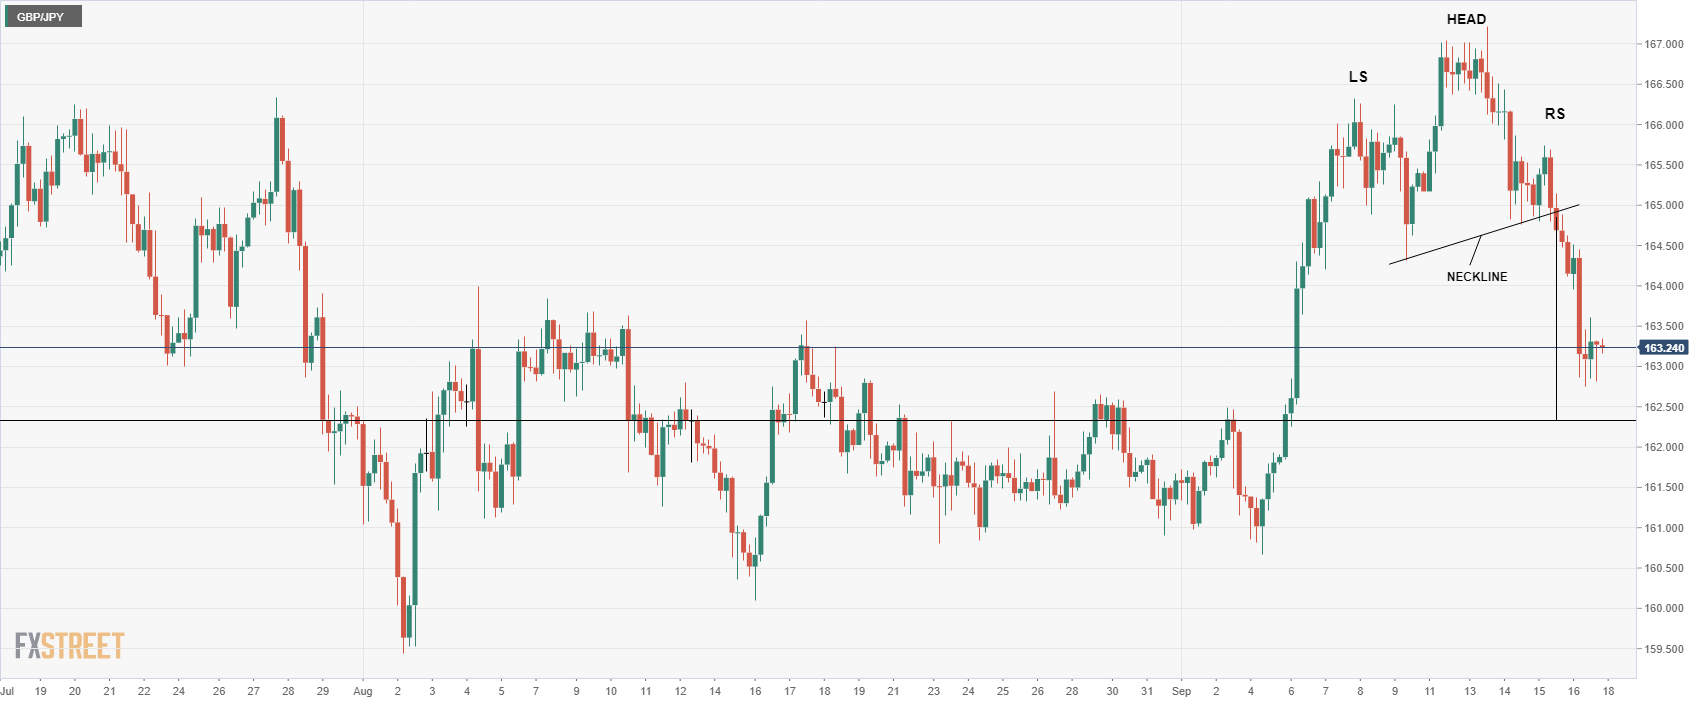
GBP/JPY Price Analysis: Technical outlook

From a daily chart perspective, the GBP/JPY is neutral biased, after sliding below the 55-day EMA. It’s worth noting that the cross, tumbled below the August 17 daily low at 163.55, opening the door for further losses. Even though, the GBP/JPY reached a daily low at around 162.73 and failed to stick below 163.00, the bias shifted to neutral-downwards.

Short term, the GBP/JPY four-hour scale depicts the cross-currency pair formed a head-and-shoulders chart pattern, which targets a drop towards 162.30, as measured from head-to-the-neckline chart pattern. On Friday, the GBP/JPY tumbled from around 164.50, and reached a daily low at 162.73, shy of the target. Nevertheless, the GBP/JPY bias remain downwards, so it might reach the head-and-shoulders target, in the near term.

Therefore, the GBP/JPY first support would be the 163.00 psychological level. A breach of the latter will expose the September 16 cycle low at 162.73, followed by the head-and-shoulders target at 162.30.

GBP/JPY Key Technical Levels

GBP/JPY

Overview
Today last price 163.24
Today Daily Change -1.32
Today Daily Change % -0.80
Today daily open 164.56
 
Trends
Daily SMA20 163.27
Daily SMA50 163.28
Daily SMA100 163.06
Daily SMA200 159.99
 
Levels
Previous Daily High 165.74
Previous Daily Low 164.48
Previous Weekly High 166.32
Previous Weekly Low 160.66
Previous Monthly High 163.99
Previous Monthly Low 159.45
Daily Fibonacci 38.2% 164.96
Daily Fibonacci 61.8% 165.26
Daily Pivot Point S1 164.12
Daily Pivot Point S2 163.67
Daily Pivot Point S3 162.86
Daily Pivot Point R1 165.37
Daily Pivot Point R2 166.18
Daily Pivot Point R3 166.63


Share: Feed news

Information on these pages contains forward-looking statements that involve risks and uncertainties. Markets and instruments profiled on this page are for informational purposes only and should not in any way come across as a recommendation to buy or sell in these assets. You should do your own thorough research before making any investment decisions. FXStreet does not in any way guarantee that this information is free from mistakes, errors, or material misstatements. It also does not guarantee that this information is of a timely nature. Investing in Open Markets involves a great deal of risk, including the loss of all or a portion of your investment, as well as emotional distress. All risks, losses and costs associated with investing, including total loss of principal, are your responsibility. The views and opinions expressed in this article are those of the authors and do not necessarily reflect the official policy or position of FXStreet nor its advertisers. The author will not be held responsible for information that is found at the end of links posted on this page.

If not otherwise explicitly mentioned in the body of the article, at the time of writing, the author has no position in any stock mentioned in this article and no business relationship with any company mentioned. The author has not received compensation for writing this article, other than from FXStreet.

FXStreet and the author do not provide personalized recommendations. The author makes no representations as to the accuracy, completeness, or suitability of this information. FXStreet and the author will not be liable for any errors, omissions or any losses, injuries or damages arising from this information and its display or use. Errors and omissions excepted.

The author and FXStreet are not registered investment advisors and nothing in this article is intended to be investment advice.

Recommended content


Recommended content

Editors’ Picks

EUR/USD stays below 1.1100, looks to post weekly losses

EUR/USD stays below 1.1100, looks to post weekly losses

EUR/USD continues to trade in a narrow range below 1.1100 and remains on track to end the week in negative territory. Earlier in the day, monthly PCE inflation data from the US came in line with the market expectation, failing to trigger a reaction.

EUR/USD News
GBP/USD struggles to find a foothold, trades near 1.3150

GBP/USD struggles to find a foothold, trades near 1.3150

GBP/USD stays on the back foot and trades in negative territory at around 1.3150 on Friday. The US Dollar holds its ground following the July PCE inflation data and doesn't allow the pair to stage a rebound heading into the weekend.

GBP/USD News
Gold retreats toward $2,500 ahead of the weekend

Gold retreats toward $2,500 ahead of the weekend

Gold stays under modest bearish pressure and declines toward $2,500 in the American session on Friday. The 10-year US Treasury bond yield edges higher toward 3.9% after US PCE inflation data, causing XAU/USD to stretch lower.

Gold News
Week ahead – Investors brace for NFP amid Fed rate cut speculation

Week ahead – Investors brace for NFP amid Fed rate cut speculation

Here comes another NFP week, with investors eagerly awaiting the results as they try to discern the size and pace of the Fed’s forthcoming rate cuts. The weaker than expected July numbers triggered market turbulence, instilling fears about a potential recession in the US.

Read more
Easing Eurozone inflation to back an ECB rate cut in September

Easing Eurozone inflation to back an ECB rate cut in September Premium

Eurostat will publish the preliminary estimate of the August Eurozone Harmonized Index of Consumer Prices on Friday, and the anticipated outcome will back up the case for another European Central Bank interest rate cut when policymakers meet in September.

Read more
Moneta Markets review 2024: All you need to know

Moneta Markets review 2024: All you need to know

VERIFIED In this review, the FXStreet team provides an independent and thorough analysis based on direct testing and real experiences with Moneta Markets – an excellent broker for novice to intermediate forex traders who want to broaden their knowledge base.

Read More

Forex MAJORS

Cryptocurrencies

Signatures