GBP/JPY Price Analysis: The first upside target is seen above 200.50


  • GBP/JPY hovers around 200.00 in Tuesday’s early European session. 
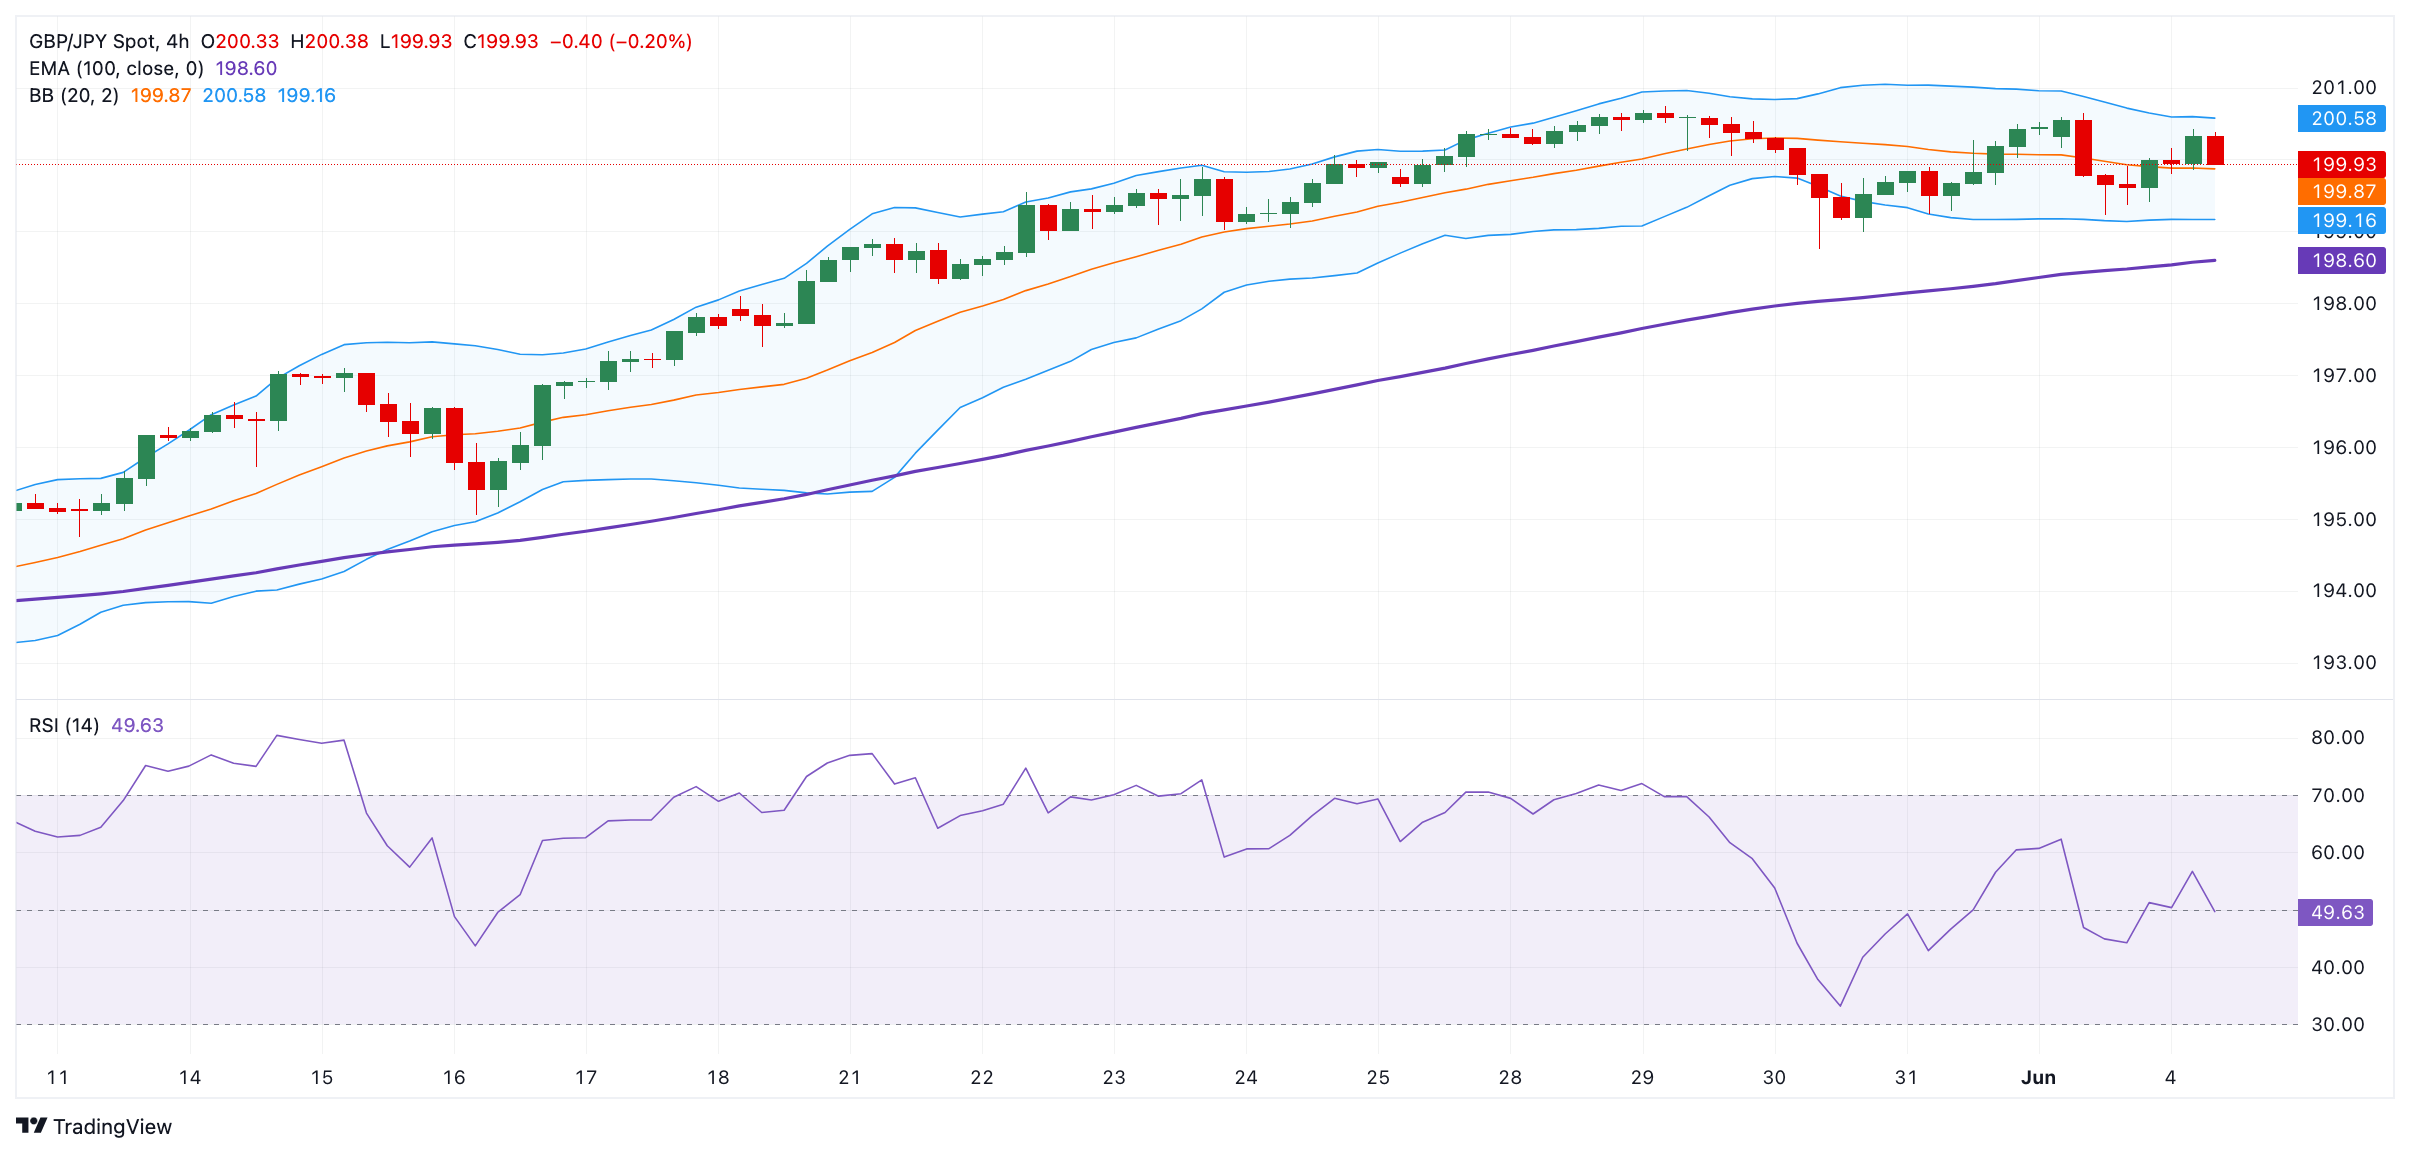
  • The cross keeps the positive stance above the 100-period EMA on the 4-hour chart, with a bullish RSI indicator. 
  • The first upside target is seen at  200.60; the initial support level is located at 199.40.

The GBP/JPY cross holds positive ground near 200.00 during the early European session on Tuesday. The interest rate differential between the United Kingdom and Japan continued to undermine the Japanese Yen (JPY) and create a tailwind for GBP/JPY. However, the verbal intervention from Japanese authorities might cap the upside for the cross in the near term. 

Technically, the bullish outlook of GBP/JPY remains intact as the cross holds above the key 100-period Exponential, Moving Average (EMA) on the 4-hour chart. The upward momentum is supported by the 14-day Relative Strength Index (RSI), which stands in bullish territory around 54.0. This indicates that the path of least resistance level is to the upside. 

The immediate upside target will emerge near the upper boundary of Bollinger Band at 200.60. A bullish breakout above this level will pave the way to the 201.00 psychological mark.

On the flip side, the initial support level for the cross is seen near a low of June 3 at 199.40. The next contention level to watch is the lower limit of the Bollinger Band at 199.16. Further south, the key barrier is located at the 100-period EMA at 198.60. 

GBP/JPY

Overview
Today last price 200.05
Today Daily Change 0.16
Today Daily Change % 0.08
Today daily open 199.89
 
Trends
Daily SMA20 197.94
Daily SMA50 194.69
Daily SMA100 191.89
Daily SMA200 187.67
 
Levels
Previous Daily High 200.65
Previous Daily Low 199.25
Previous Weekly High 200.75
Previous Weekly Low 198.76
Previous Monthly High 200.75
Previous Monthly Low 191.37
Daily Fibonacci 38.2% 199.78
Daily Fibonacci 61.8% 200.12
Daily Pivot Point S1 199.21
Daily Pivot Point S2 198.53
Daily Pivot Point S3 197.81
Daily Pivot Point R1 200.61
Daily Pivot Point R2 201.33
Daily Pivot Point R3 202.02


Share: Feed news

Information on these pages contains forward-looking statements that involve risks and uncertainties. Markets and instruments profiled on this page are for informational purposes only and should not in any way come across as a recommendation to buy or sell in these assets. You should do your own thorough research before making any investment decisions. FXStreet does not in any way guarantee that this information is free from mistakes, errors, or material misstatements. It also does not guarantee that this information is of a timely nature. Investing in Open Markets involves a great deal of risk, including the loss of all or a portion of your investment, as well as emotional distress. All risks, losses and costs associated with investing, including total loss of principal, are your responsibility. The views and opinions expressed in this article are those of the authors and do not necessarily reflect the official policy or position of FXStreet nor its advertisers. The author will not be held responsible for information that is found at the end of links posted on this page.

If not otherwise explicitly mentioned in the body of the article, at the time of writing, the author has no position in any stock mentioned in this article and no business relationship with any company mentioned. The author has not received compensation for writing this article, other than from FXStreet.

FXStreet and the author do not provide personalized recommendations. The author makes no representations as to the accuracy, completeness, or suitability of this information. FXStreet and the author will not be liable for any errors, omissions or any losses, injuries or damages arising from this information and its display or use. Errors and omissions excepted.

The author and FXStreet are not registered investment advisors and nothing in this article is intended to be investment advice.

Recommended content


Recommended content

Editors’ Picks

EUR/USD retreats to 1.0700 area following post-PCE jump

EUR/USD retreats to 1.0700 area following post-PCE jump

After spiking to a daily high of 1.0720 with the immediate reaction to US PCE inflation data, EUR/USD lost its traction and declined to the 1.0700 area. Investors remain cautious ahead of this weekend's French election and make it difficult for the Euro to gather strength.

EUR/USD News

GBP/USD stays below 1.2650 after US inflation data

GBP/USD stays below 1.2650 after US inflation data

GBP/USD struggles to preserve its bullish momentum and trades below 1.2650 in the American session on Friday. Earlier in the day, the data from the US showed that the annual core PCE inflation declined to 2.6% in May, limiting the USD's upside and helping the pair hold its ground.

GBP/USD News

Gold keeps its daily gains near $2,330 following US PCE data

Gold keeps its daily gains near $2,330 following US PCE data

Gold prices maintain their constructive bias around $2,330 after US inflation readings gauged by the PCE matched consensus in May and US yields advance slightly across the curve.

Gold News

BTC struggles around the $62,000 level

BTC struggles around the $62,000 level

Bitcoin price faces pullback resistance at the lower band of the descending wedge around $62,000. Ethereum price finds support at $3,288, the 61.8% Fibonacci retracement level. Ripple price faces resistance at $0.500, its daily resistance level.

Read more

French Elections Preview: Euro to suffer after the calm, as specter of extremists, uncertainty rise Premium

French Elections Preview: Euro to suffer after the calm, as specter of extremists, uncertainty rise

The first round of French parliamentary elections is set to trigger high uncertainty. Soothing messages from the far right and far left leave the Euro vulnerable to falls. Calm may return only after the second round of voting on  July 7.

Read more

Forex MAJORS

Cryptocurrencies

Signatures