- GBP/JPY tests last year’s high at 172.13, as oscillators turned overbought.
- The GBP/JPY first resistance is at 172.00, next target is at 172.09.
- A bearish engulfing candle pattern could exacerbate GBP/JPY fall.
The GBP/JPY surged and tested the last year’s high at around 172.13, though it retraced slightly and remained below the 172.00 mark. As the Asian session starts, the GBP/JPY is trading at 171.74, posting minuscule gains of 0.02%.
GBP/JPY Price Action
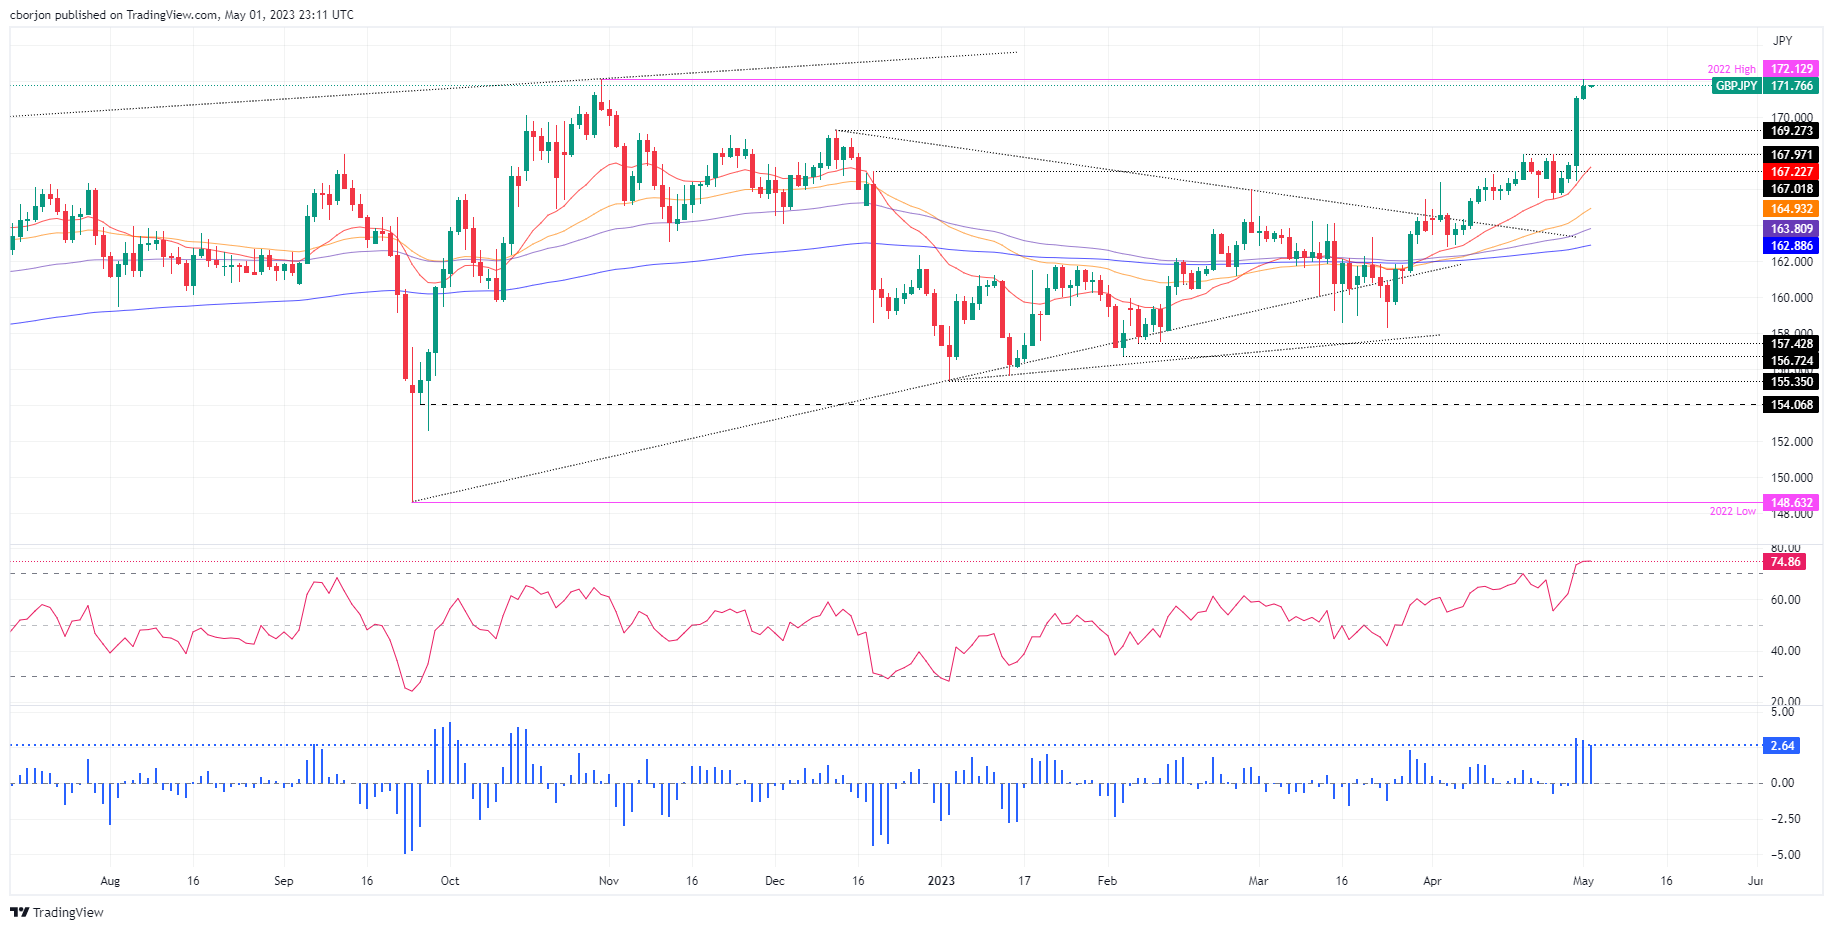
The daily GBP/JPY chart portrays the pair in a solid uptrend, though the cross-currency pair fell shy of reaching the last year’s high. However, oscillators like the Relative Strength Index (RSI) indicator are overbought. Meanwhile, the Rate of Change (RoC) shows buyers remain in charge. But it should be said that when the RoC reached current levels twice, it was followed by some pullbacks before continuing the uptrend.
If GBP/JPY breaks 172.00, the next resistance would be the YTD high at 172.09. A breach of the latter will expose the last year’s high at 172.13, followed by the 173.00 figure.
Conversely, if the GBP/JPY registers a bearish engulfing candle pattern, that would exacerbate a fall toward the 20-day EMA at 167.22. But firstly, the GBP/JPY pair must cross below the 170.00 figure. Once cleared, the next demand area defended by buyers will be December’s 13 swing high turned support at 169.27 before testing 169.00. A breach of the latter will expose the 20-day EMA at 167.22.
GBP/JPY Daily Chart
Information on these pages contains forward-looking statements that involve risks and uncertainties. Markets and instruments profiled on this page are for informational purposes only and should not in any way come across as a recommendation to buy or sell in these assets. You should do your own thorough research before making any investment decisions. FXStreet does not in any way guarantee that this information is free from mistakes, errors, or material misstatements. It also does not guarantee that this information is of a timely nature. Investing in Open Markets involves a great deal of risk, including the loss of all or a portion of your investment, as well as emotional distress. All risks, losses and costs associated with investing, including total loss of principal, are your responsibility. The views and opinions expressed in this article are those of the authors and do not necessarily reflect the official policy or position of FXStreet nor its advertisers. The author will not be held responsible for information that is found at the end of links posted on this page.
If not otherwise explicitly mentioned in the body of the article, at the time of writing, the author has no position in any stock mentioned in this article and no business relationship with any company mentioned. The author has not received compensation for writing this article, other than from FXStreet.
FXStreet and the author do not provide personalized recommendations. The author makes no representations as to the accuracy, completeness, or suitability of this information. FXStreet and the author will not be liable for any errors, omissions or any losses, injuries or damages arising from this information and its display or use. Errors and omissions excepted.
The author and FXStreet are not registered investment advisors and nothing in this article is intended to be investment advice.


Recommended content
Editors’ Picks

ECB reduces rates by 25 bps as largely expected – LIVE
On Thursday, the ECB delivered the 25 bps cut everyone expected, trimming the Deposit Facility Rate to 2.25%. EUR/USD remained within its daily sideline theme around the 1.1350-1.1360 band in the wake of the release. Now, all eyes are on Christine Lagarde’s live press conference as investors hang on her every word for clues about what comes next.

GBP/USD trades in an inconclusive fashion around 1.3230
GBP/USD is stuck in the 1.3250–1.3260 corridor on Thursday, maintaining a rangebound mood in response to the acceptable bounce in the Greenback and the generalised offered bias in the broad risk-linked galaxy.

Gold remains affered, recedes to the $3,340 area post-ECB
Gold powered to a fresh record, flirting with the $3,360 area per troy ounce, before embarking on a correction to the current $3,340 zone, always on the back of the decent rebound in the US Dollar and the recovery in US Treasury yields across the curve.

Crypto market cap fell more than 18% in Q1, wiping out $633.5 billion after Trump’s inauguration top
CoinGecko’s Q1 Crypto Industry Report highlights that the total crypto market capitalization fell by 18.6% in the first quarter, wiping out $633.5 billion after topping on January 18, just a couple of days ahead of US President Donald Trump’s inauguration.

Future-proofing portfolios: A playbook for tariff and recession risks
It does seem like we will be talking tariffs for a while. And if tariffs stay — in some shape or form — even after negotiations, we’ll likely be talking about recession too. Higher input costs, persistent inflation, and tighter monetary policy are already weighing on global growth.

The Best brokers to trade EUR/USD
SPONSORED Discover the top brokers for trading EUR/USD in 2025. Our list features brokers with competitive spreads, fast execution, and powerful platforms. Whether you're a beginner or an expert, find the right partner to navigate the dynamic Forex market.